PROTECTED SOURCE SCRIPT
Trend Band
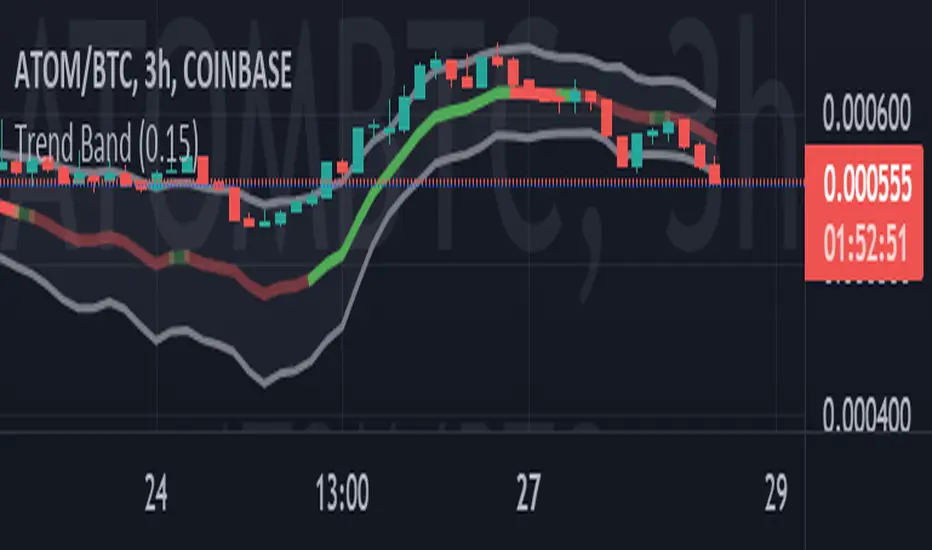
The volume-weighted, exponential running mean is computed. It is shown as the thick line. The plus-minus one standard deviation band is also shown with two thinner lines.
In contrast to other RAs, it is the trading volumes that are being processed here instead of the price itself.
For the averaging, the weight of the present relative to the past can be chosen by the user. It’s a number between 0 and 1. There are no other (hidden) parameters.
A price outside the band may be an indication that the security is overbought or oversold. It can also be an indication of a beginning trend. Disclaimer: No miracles!
Two alerts are included and act accordingly.
The color of the mean line comes from the derivative averaged the same way. The second derivative (reversals) is still to come.
受保護腳本
此腳本以閉源形式發佈。 不過,您可以自由且不受任何限制地使用它 — 在此處了解更多資訊。
免責聲明
這些資訊和出版物並不意味著也不構成TradingView提供或認可的金融、投資、交易或其他類型的意見或建議。請在使用條款閱讀更多資訊。
免責聲明
這些資訊和出版物並不意味著也不構成TradingView提供或認可的金融、投資、交易或其他類型的意見或建議。請在使用條款閱讀更多資訊。