OPEN-SOURCE SCRIPT
已更新 Turbulence reversal
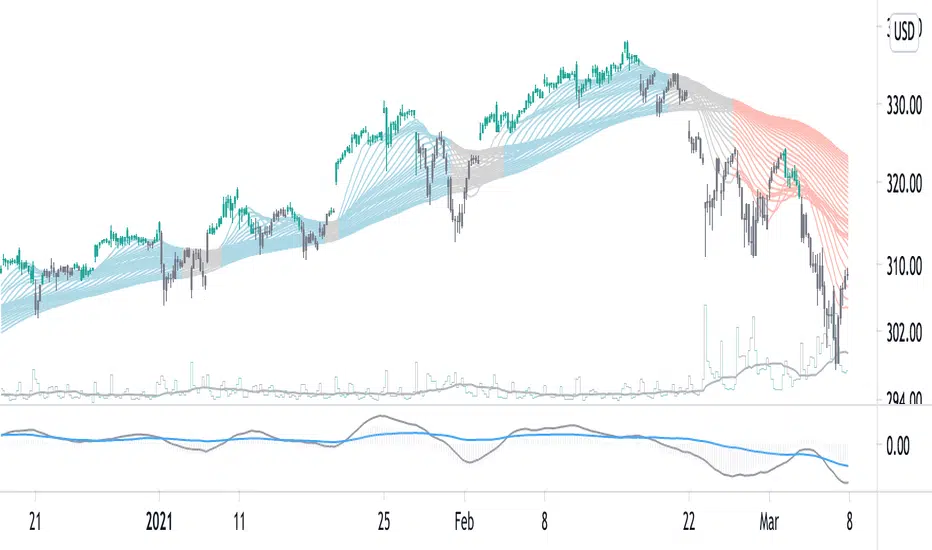
Given that the market turbulence tends to cluster, I developed a turbulence moving average system to reveal the unseen underlying structure of the least resistance path for trend following.
Here, I used an SMA subset from the turbulence moving average system to determine the trend direction. This estimation is achieved by calculating the dynamic changes of SMA slope angle and distance between SMA. The former represents a possible reversal signal, and the latter shows the resistance from the intermediate-term SMA.
When the short-term slope angle crossovers the intermediate-term slope angle, the indicator will give a star sign, indicating a possible trend reversal.
Use this indicator together with the turbulence moving average system (Turbulence with direction).
發行說明
Update: This update removes resistance calculation and replaces the asterisk with a triangle for the reversal signal.發行說明
Add plot titles.發行說明
Add a signal switch.開源腳本
秉持TradingView一貫精神,這個腳本的創作者將其設為開源,以便交易者檢視並驗證其功能。向作者致敬!您可以免費使用此腳本,但請注意,重新發佈代碼需遵守我們的社群規範。
免責聲明
這些資訊和出版物並非旨在提供,也不構成TradingView提供或認可的任何形式的財務、投資、交易或其他類型的建議或推薦。請閱讀使用條款以了解更多資訊。
免責聲明
這些資訊和出版物並非旨在提供,也不構成TradingView提供或認可的任何形式的財務、投資、交易或其他類型的建議或推薦。請閱讀使用條款以了解更多資訊。