OPEN-SOURCE SCRIPT
Risk-On / Risk-Off Score
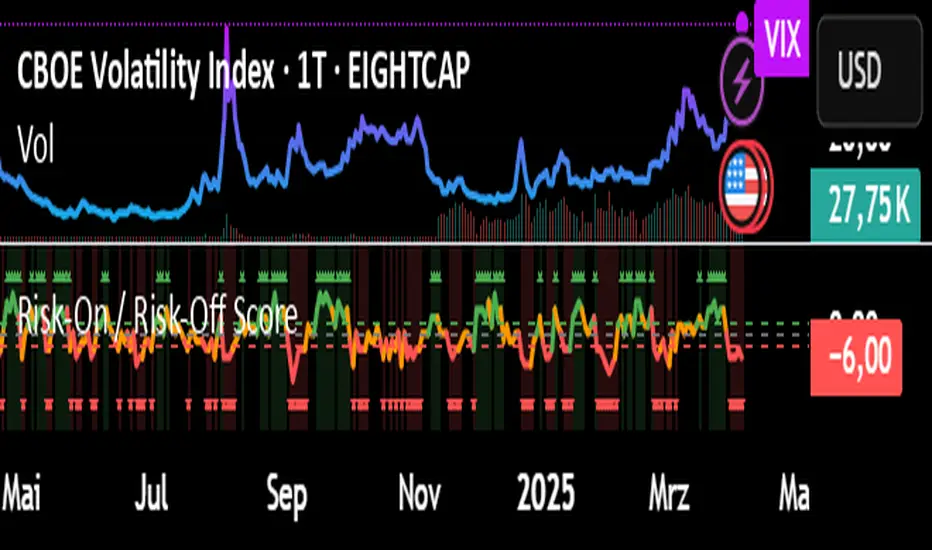
Risk-On / Risk-Off Score (Macro Sentiment Indicator)
This indicator calculates a custom Risk-On / Risk-Off Score to objectively assess the current market risk sentiment using a carefully selected basket of macroeconomic assets and intermarket relationships.
🧠 What does this indicator do?
The score is based on 14 key components grouped into three categories:
🟢 Risk-On Assets (rising = appetite for risk)
(+1 if performance over X days is positive, otherwise –1)
NASDAQ 100 (NAS100USD)
S&P 500 (SPX)
Bitcoin (BTCUSD)
Copper (HG1!)
WTI Crude Oil (CLK2025)
🔴 Risk-Off Assets (rising = flight to safety)
(–1 if performance is positive, otherwise +1)
Gold (XAUUSD)
US Treasury Bonds (TLT ETF) (TLT)
US Dollar Index (DXY)
USD/CHF
USD/JPY
US 10Y Yields (US10Y) (yields are interpreted inversely)
⚖️ Risk Spreads / Relative Indicators
(+1 if rising, –1 if falling)
Copper/Gold Ratio → HG1! / XAUUSD
NASDAQ/VIX Ratio → NAS100USD / VIX
HYG/TLT Ratio → HYG / TLT
📏 Score Calculation
Total score = sum of all components
Range: from –14 (extreme Risk-Off) to +14 (strong Risk-On)
Color-coded output:
🟢 Score > 2 = Risk-On
🟠 –2 to +2 = Neutral
🔴 Score < –2 = Risk-Off
Displayed as a line plot with background color and signal markers
🧪 Timeframe of analysis:
Default: 5 days (adjustable via input)
Calculated using Rate of Change (% change)
🧭 Use Cases:
Quickly assess macro sentiment
Filter for position sizing, hedging, or intraday bias
Especially useful for:
Swing traders
Day traders with macro filters
Volatility and options traders
📌 Note:
This is not a buy/sell signal indicator, but a contextual sentiment tool designed to help you stay aligned with overall market conditions.
開源腳本
秉持TradingView一貫精神,這個腳本的創作者將其設為開源,以便交易者檢視並驗證其功能。向作者致敬!您可以免費使用此腳本,但請注意,重新發佈代碼需遵守我們的社群規範。
免責聲明
這些資訊和出版物並非旨在提供,也不構成TradingView提供或認可的任何形式的財務、投資、交易或其他類型的建議或推薦。請閱讀使用條款以了解更多資訊。
免責聲明
這些資訊和出版物並非旨在提供,也不構成TradingView提供或認可的任何形式的財務、投資、交易或其他類型的建議或推薦。請閱讀使用條款以了解更多資訊。