OPEN-SOURCE SCRIPT
已更新 Linear Mean Reversion Strategy
📘 Strategy Introduction: Linear Mean Reversion with Fixed Stop
This strategy implements a simple yet powerful mean reversion model that assumes price tends to oscillate around a dynamic average over time. It identifies statistically significant deviations from the moving average using a z-score, and enters trades expecting a return to the mean.
🧠 Core Logic:
A z-score is calculated by comparing the current price to its moving average, normalized by standard deviation, over a user-defined half-life window.
Trades are entered when the z-score crosses a threshold (e.g., ±1), signaling overbought or oversold conditions.
The strategy exits positions either when price reverts back near the mean (z-score close to 0), or if a fixed stop loss of 100 points is hit, whichever comes first.
⚙️ Key Features:
Dynamic mean and volatility estimation using moving average and standard deviation
Configurable z-score thresholds for entry and exit
Position size scaling based on z-score magnitude
Fixed stop loss to control risk and avoid prolonged drawdowns
🧪 Use Case:
Ideal for range-bound markets or assets that exhibit stationary behavior around a mean, this strategy is especially useful on assets with mean-reverting characteristics like currency pairs, ETFs, or large-cap stocks. It is best suited for traders looking for short-term reversions rather than long-term trends.
發行說明
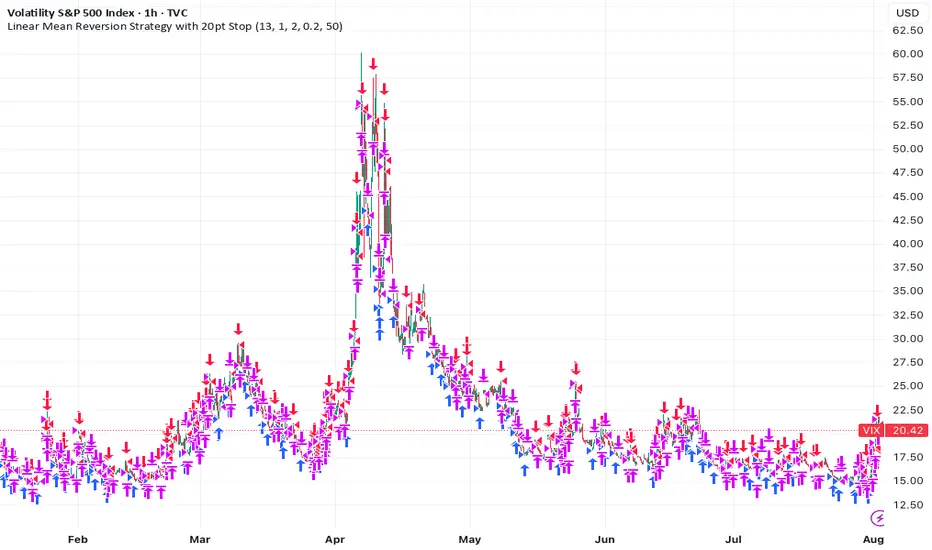
The idea is simple: if an instrument’s price is truly mean-reverting, we can expect it to return to its long-term average. Most assets, however, behave more like random walks and show little tendency to revert. The VIX—an index of S&P 500 volatility—is a notable exception, exhibiting clear mean-reversion.
For this strategy, I’ve assumed a trading cost of 0.1%, which seems reasonable given the typical bid-ask spread on the VIX is about 0.18 points.
A z-score is calculated by comparing the current price to its moving average, normalized by standard deviation, over a user-defined half-life window.
Trades are entered when the z-score crosses a threshold (e.g., ±1), signaling overbought or oversold conditions.
The strategy exits positions either when price reverts back near the mean (z-score close to 0), or if a fixed stop loss is hit, whichever comes first.
Designed for a 1 H window, where the VIX’s mean reversion and assumed costs tend to align well.
開源腳本
秉持TradingView一貫精神,這個腳本的創作者將其設為開源,以便交易者檢視並驗證其功能。向作者致敬!您可以免費使用此腳本,但請注意,重新發佈代碼需遵守我們的社群規範。
免責聲明
這些資訊和出版物並非旨在提供,也不構成TradingView提供或認可的任何形式的財務、投資、交易或其他類型的建議或推薦。請閱讀使用條款以了解更多資訊。
免責聲明
這些資訊和出版物並非旨在提供,也不構成TradingView提供或認可的任何形式的財務、投資、交易或其他類型的建議或推薦。請閱讀使用條款以了解更多資訊。