OPEN-SOURCE SCRIPT
Fourier Trend Energy (Prototype)
Fourier Trend Energy (Prototype)
This indicator brings the logic of Fourier-based trend analysis into Pine Script.
It estimates two key components:
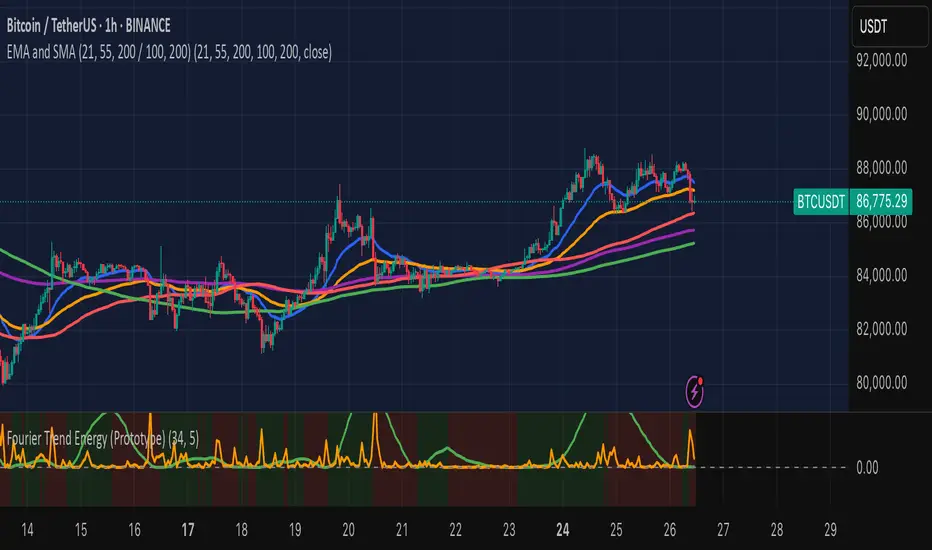
Low-Frequency Energy — representing the strength of the underlying trend
High-Frequency Energy — representing noise, volatility, or deviation from the trend
🔹 Green line → trend strength
🔸 Orange line → short-term noise
🟩🟥 Background color → shows whether trend energy is increasing or decreasing
You can use it to:
Detect early trend formation
Filter fakeouts during consolidation
Spot momentum shifts based on energy crossovers
This is not a traditional oscillator — it’s a frequency-inspired tool to help you understand when the market is charging for a move.
This indicator brings the logic of Fourier-based trend analysis into Pine Script.
It estimates two key components:
Low-Frequency Energy — representing the strength of the underlying trend
High-Frequency Energy — representing noise, volatility, or deviation from the trend
🔹 Green line → trend strength
🔸 Orange line → short-term noise
🟩🟥 Background color → shows whether trend energy is increasing or decreasing
You can use it to:
Detect early trend formation
Filter fakeouts during consolidation
Spot momentum shifts based on energy crossovers
This is not a traditional oscillator — it’s a frequency-inspired tool to help you understand when the market is charging for a move.
開源腳本
秉持TradingView一貫精神,這個腳本的創作者將其設為開源,以便交易者檢視並驗證其功能。向作者致敬!您可以免費使用此腳本,但請注意,重新發佈代碼需遵守我們的社群規範。
免責聲明
這些資訊和出版物並非旨在提供,也不構成TradingView提供或認可的任何形式的財務、投資、交易或其他類型的建議或推薦。請閱讀使用條款以了解更多資訊。
免責聲明
這些資訊和出版物並非旨在提供,也不構成TradingView提供或認可的任何形式的財務、投資、交易或其他類型的建議或推薦。請閱讀使用條款以了解更多資訊。