OPEN-SOURCE SCRIPT
QM Signal [TradingFinder] Quasimodo Pattern - Head and Shoulders
🔵 Introduction
One of the patterns in "RTM" is the "QM" pattern, also known as "Quasimodo". Its name is derived from the appearance of "Hunchback of Notre-Dame" from Victor Hugo's novel. It is a type of "Head and Shoulders" pattern.
🔵 Formation Method
🟣 Upward Trend
In an upward trend, the left shoulder is formed, and the price creates a new peak higher than the left shoulder peak [HEAD]. After a decline, it manages to break the previous low [CHOCH] and move upward again. We expect the price to return approximately between [HEAD] and [Left Shoulder] to form the "QM" pattern.

🟣 Downward Trend
In a downward trend, with a price decline, a new valley is created, forming the left shoulder, and the price forms a new valley lower than the left shoulder valley [HEAD]. After a price increase, it manages to break the previous high [CHOCH] and move downward again. We expect the price to return approximately between [HEAD] and [Left Shoulder] to form the "Quasimodo" pattern.

Note: The "QM" pattern is a specific type of head and shoulders pattern in which in the first move, the previous support is broken and it's the best condition for price reversal.
🔵 Entry Conditions for "Buy" and "Sell"
🟢 Buy
Buy Position: When a complete "QM" pattern is formed in a downtrend; we expect the price to reach the left shoulder area (with confirmation) during the retracement to enter the "BUY" position.
Profit Target in Buy Scenario: Expecting a move to the peak that broke it and the highest point in the current "Swing".
Stop Loss: Below the "Head," which is the lowest point.

🔴 Sell
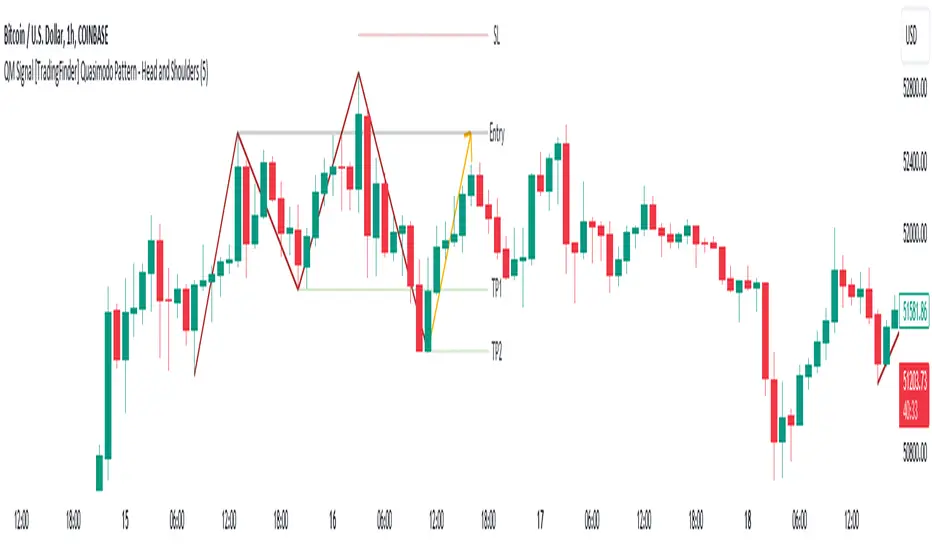
Sell Position: When a "QM" pattern is formed in an uptrend, we look for entry into the "Sell" position as the price retraces to the left shoulder area.
Profit Target in Sell Scenario: Expecting a move to the price floor that has been broken [TP1] and the entire "Swing" or [TP2].
Take Profit: Above the highest point or above the [Head] area will be the "SL" region.

Note: Certainly, no method alone guarantees trading capability and requires different confirmations. This indicator only detects the "QM" pattern, and the rest of the analysis will be the responsibility of the user.
Note: These profit and loss limits are based on market movements [Market Structure] and will be provided as approximate and supportive.
One of the patterns in "RTM" is the "QM" pattern, also known as "Quasimodo". Its name is derived from the appearance of "Hunchback of Notre-Dame" from Victor Hugo's novel. It is a type of "Head and Shoulders" pattern.
🔵 Formation Method
🟣 Upward Trend
In an upward trend, the left shoulder is formed, and the price creates a new peak higher than the left shoulder peak [HEAD]. After a decline, it manages to break the previous low [CHOCH] and move upward again. We expect the price to return approximately between [HEAD] and [Left Shoulder] to form the "QM" pattern.
🟣 Downward Trend
In a downward trend, with a price decline, a new valley is created, forming the left shoulder, and the price forms a new valley lower than the left shoulder valley [HEAD]. After a price increase, it manages to break the previous high [CHOCH] and move downward again. We expect the price to return approximately between [HEAD] and [Left Shoulder] to form the "Quasimodo" pattern.
Note: The "QM" pattern is a specific type of head and shoulders pattern in which in the first move, the previous support is broken and it's the best condition for price reversal.
🔵 Entry Conditions for "Buy" and "Sell"
🟢 Buy
Buy Position: When a complete "QM" pattern is formed in a downtrend; we expect the price to reach the left shoulder area (with confirmation) during the retracement to enter the "BUY" position.
Profit Target in Buy Scenario: Expecting a move to the peak that broke it and the highest point in the current "Swing".
Stop Loss: Below the "Head," which is the lowest point.
🔴 Sell
Sell Position: When a "QM" pattern is formed in an uptrend, we look for entry into the "Sell" position as the price retraces to the left shoulder area.
Profit Target in Sell Scenario: Expecting a move to the price floor that has been broken [TP1] and the entire "Swing" or [TP2].
Take Profit: Above the highest point or above the [Head] area will be the "SL" region.
Note: Certainly, no method alone guarantees trading capability and requires different confirmations. This indicator only detects the "QM" pattern, and the rest of the analysis will be the responsibility of the user.
Note: These profit and loss limits are based on market movements [Market Structure] and will be provided as approximate and supportive.
開源腳本
秉持TradingView一貫精神,這個腳本的創作者將其設為開源,以便交易者檢視並驗證其功能。向作者致敬!您可以免費使用此腳本,但請注意,重新發佈代碼需遵守我們的社群規範。
💎Get instant (Demo/Vip) access here: tradingFinder.com/
✅Get access to our support team: t.me/TFLABS
🧠Free Forex, Crypto & Stock Trading tutorial, same as ICT, Smart Money & Price Action:
tradingfinder.com/education/forex/
✅Get access to our support team: t.me/TFLABS
🧠Free Forex, Crypto & Stock Trading tutorial, same as ICT, Smart Money & Price Action:
tradingfinder.com/education/forex/
免責聲明
這些資訊和出版物並非旨在提供,也不構成TradingView提供或認可的任何形式的財務、投資、交易或其他類型的建議或推薦。請閱讀使用條款以了解更多資訊。