OPEN-SOURCE SCRIPT
2024 - Seasonality - Open to Close
Script Description:
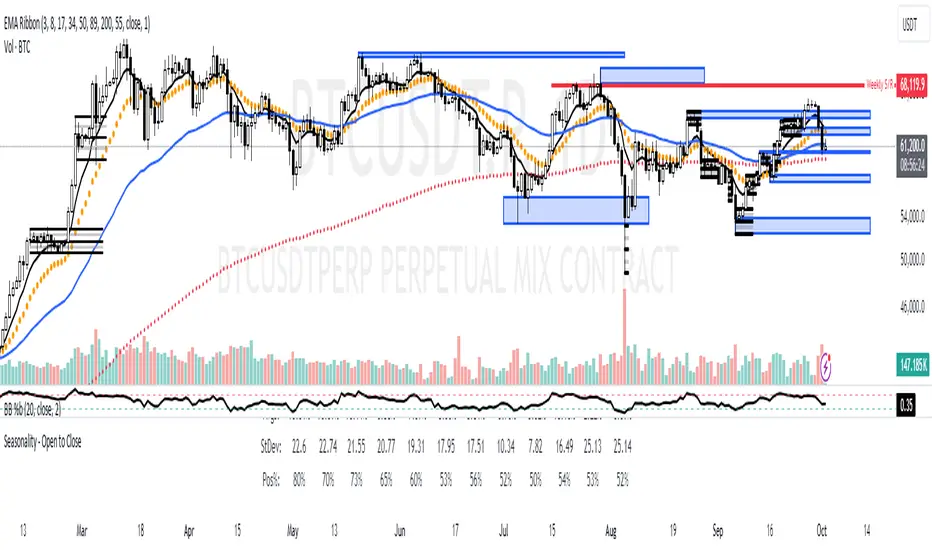
This Pine Script is designed to visualise **seasonality** in the financial markets by calculating the **open-to-close percentage change** for each month of a selected asset. It creates a **heatmap** table to display the monthly performance over multiple years. The script provides detailed statistical summaries, including:
- **Average monthly percentage changes**
- **Standard deviation** of the changes
- **Percentage of months with positive returns**
The script also allows users to adjust colour intensities for positive and negative values, specify which year to start from, and skip specific months. Key metrics such as averages, standard deviations, and percentages of positive months can be toggled on or off based on user preferences. The result is a clear, visual representation of how an asset typically performs month by month, aiding in seasonality analysis.
開源腳本
秉持TradingView一貫精神,這個腳本的創作者將其設為開源,以便交易者檢視並驗證其功能。向作者致敬!您可以免費使用此腳本,但請注意,重新發佈代碼需遵守我們的社群規範。
免責聲明
這些資訊和出版物並非旨在提供,也不構成TradingView提供或認可的任何形式的財務、投資、交易或其他類型的建議或推薦。請閱讀使用條款以了解更多資訊。
開源腳本
秉持TradingView一貫精神,這個腳本的創作者將其設為開源,以便交易者檢視並驗證其功能。向作者致敬!您可以免費使用此腳本,但請注意,重新發佈代碼需遵守我們的社群規範。
免責聲明
這些資訊和出版物並非旨在提供,也不構成TradingView提供或認可的任何形式的財務、投資、交易或其他類型的建議或推薦。請閱讀使用條款以了解更多資訊。