OPEN-SOURCE SCRIPT
已更新 Statistical Footprint
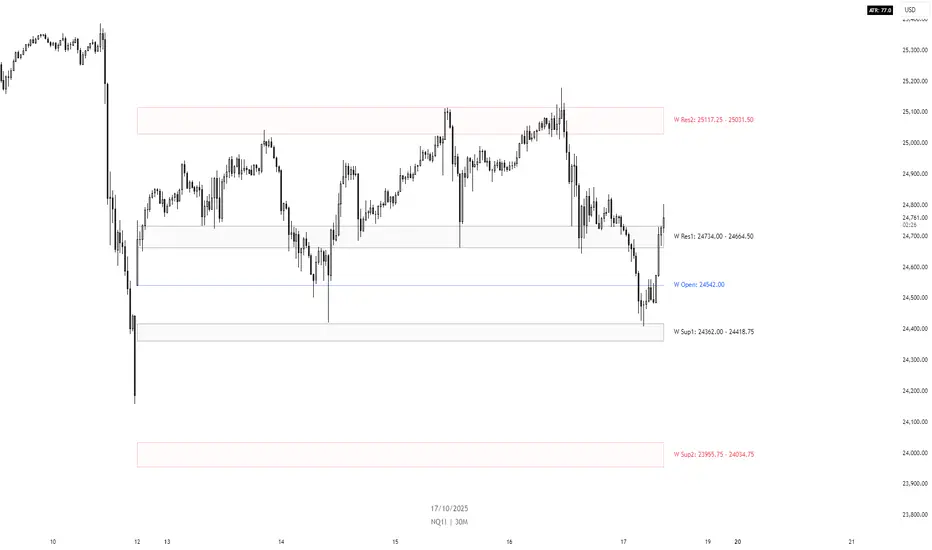
Statistical Footprint - Behavioral Support & Resistance
This indicator identifies key price levels based on actual market behavior rather than traditional pivot calculations. It analyzes how bulls and bears have historically moved price from session opens, creating statistical zones where future reactions are most likely.
The concept is simple: track how far bullish candles typically push above the open versus how far bearish candles drop below it. These patterns reveal the market's behavioral "footprint" - showing where momentum typically stalls and reverses.
Key Features:
- Separate analysis for daily and weekly timeframes
- Smart zone merging when levels cluster together (within 5 points)
- Uses both mean and median calculations for more robust levels
- XGBoost-optimized lookback periods for maximum statistical significance
- Clean zone-only display focused on actionable price areas
How it Works:
The code separates bullish and bearish sessions, measuring their typical range extensions from the open. It then projects these statistical ranges forward from current session opens, creating "behavioral zones" where the market has historically shown consistent reactions.
When daily and weekly levels align closely, they merge into combined zones with enhanced significance. Labels show both the mean and median values when they differ meaningfully.
Best Used For:
- Identifying high-probability reversal zones
- Setting profit targets based on historical behavior
- Understanding market sentiment shifts at key levels
- Confluence analysis between different timeframes
The lookback periods have been optimized using machine learning to find the most predictive historical sample sizes for current market conditions.
發行說明
Update: Updated the daily and weekly values to be more accurate.
發行說明
Updated the name to Fancy Zones.發行說明
Updated name.發行說明
Updated to version 3.0.This updates includes a few logic updates, visual updates, and cleanup.
開源腳本
秉持TradingView一貫精神,這個腳本的創作者將其設為開源,以便交易者檢視並驗證其功能。向作者致敬!您可以免費使用此腳本,但請注意,重新發佈代碼需遵守我們的社群規範。
免責聲明
這些資訊和出版物並非旨在提供,也不構成TradingView提供或認可的任何形式的財務、投資、交易或其他類型的建議或推薦。請閱讀使用條款以了解更多資訊。
開源腳本
秉持TradingView一貫精神,這個腳本的創作者將其設為開源,以便交易者檢視並驗證其功能。向作者致敬!您可以免費使用此腳本,但請注意,重新發佈代碼需遵守我們的社群規範。
免責聲明
這些資訊和出版物並非旨在提供,也不構成TradingView提供或認可的任何形式的財務、投資、交易或其他類型的建議或推薦。請閱讀使用條款以了解更多資訊。