OPEN-SOURCE SCRIPT
UCS_Option Expiry
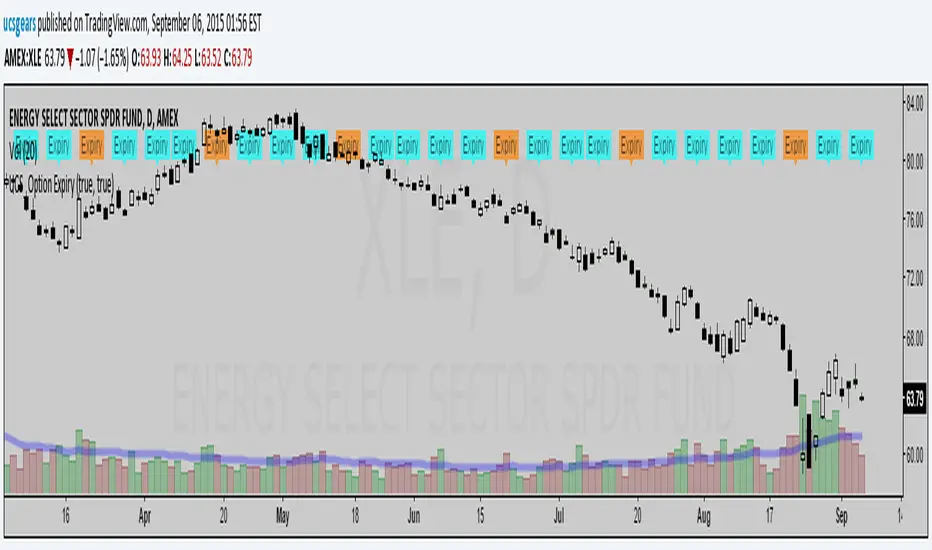
This is an update to two indicators.


The Blue Label would be the Weekly Options Expiry
The Orange Label would be the Monthly Options Expiry.
And you have a choice to pick.
------------------------
The Blue Label would be the Weekly Options Expiry
The Orange Label would be the Monthly Options Expiry.
And you have a choice to pick.
------------------------
開源腳本
本著TradingView的真正精神,此腳本的創建者將其開源,以便交易者可以查看和驗證其功能。向作者致敬!雖然您可以免費使用它,但請記住,重新發佈程式碼必須遵守我們的網站規則。
Uday C Santhakumar
免責聲明
這些資訊和出版物並不意味著也不構成TradingView提供或認可的金融、投資、交易或其他類型的意見或建議。請在使用條款閱讀更多資訊。
開源腳本
本著TradingView的真正精神,此腳本的創建者將其開源,以便交易者可以查看和驗證其功能。向作者致敬!雖然您可以免費使用它,但請記住,重新發佈程式碼必須遵守我們的網站規則。
Uday C Santhakumar
免責聲明
這些資訊和出版物並不意味著也不構成TradingView提供或認可的金融、投資、交易或其他類型的意見或建議。請在使用條款閱讀更多資訊。