INVITE-ONLY SCRIPT
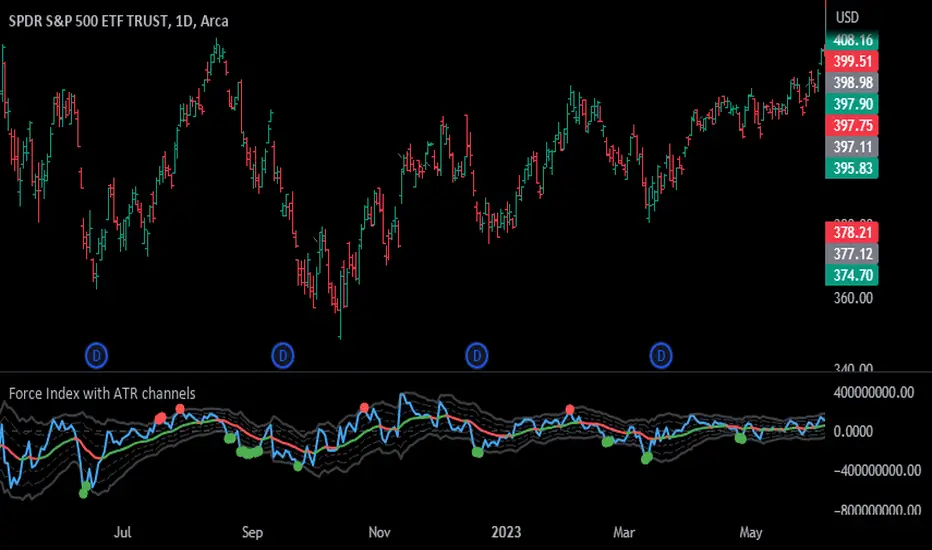
Force Index with ATR channels
-----------------------------------------------------------------
General Description:
This indicator multiplies the change of closing price for any bar by volume during that bar and plots an exponential moving average of the result. It is excellent for analyzing volume, deeper than simply looking at volume bars.
The cool thing about this particular version of the Force Index is that Average True Range (ATR) channels have been added to turn it into an excellent tool for identifying intermediate tops and bottoms. Force Index with ATR channels does not catch all turns, but the ones it identifies deserve very serious attention.
The indicator works on any market, any instrument, any timeframe, and any market condition.
-----------------------------------------------------------------
How it works:
Calculation:
Force Index = {Close (current period) - Close (prior period)} x Volume (current period)
If we smooth the indicator with a moving average the indicator gives much better trading signals.
Force Index(smoothed) = X-period EMA of Force Index
Changing the EMA length changes the focus of Force Index. Longer-term 13-bar EMA of Force Index helps identify intermediate trend reversals. Shorter-term 2-bar EMA helps identify market extremes.
The indicator also has the option to plot ATR channels to Force Index. Whenever the Force Index rises above or falls below its 3-ATR channel, it signals that the ticker has reached an area of an unsustainable extreme. That’s where rallies and declines become exhausted and prices tend to reverse. This is one of very few tools that are equally efficient in calling both top and bottom areas. This indicator places a red dot above the plot when the EMA of Force Index rises above the 3-ATR channel. It places a green dot underneath the plot when that EMA declines below the 3-ATR channel.
These signals work especially well on higher timeframes, weekly charts for example. Of course, you are welcome to experiment with them in any timeframe.
-----------------------------------------------------------------
Options/adjustments for this indicator:
* EMA Period of Force Index
* EMA Period for ATR calculations
* Plot ATRs?
* Plot ATR Signals?
免責聲明
這些資訊和出版物並不意味著也不構成TradingView提供或認可的金融、投資、交易或其他類型的意見或建議。請在使用條款閱讀更多資訊。