INVITE-ONLY SCRIPT
[TVExtBot]HeikinAshi Trend Indicator v1.0
已更新

Heikin-ashi Trend Indicator v1.0
BYBIT:BTCUSD
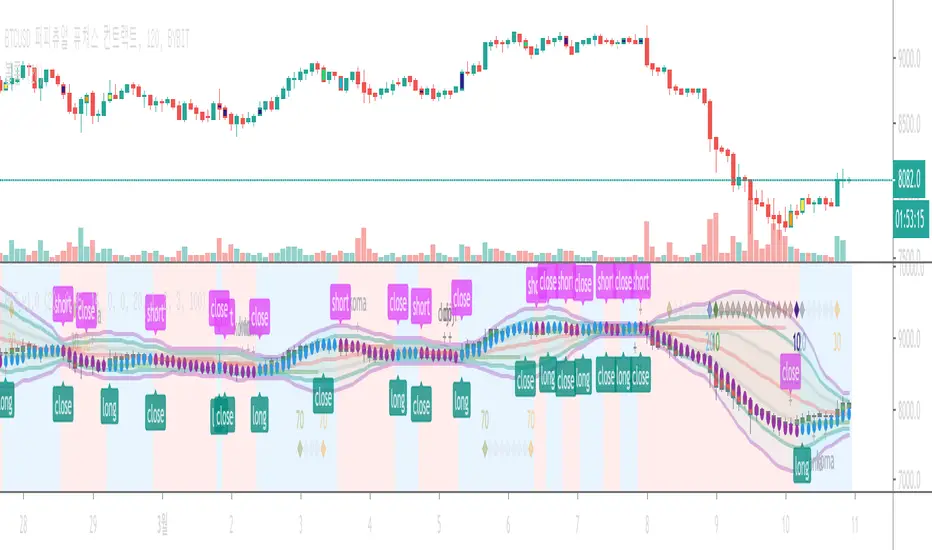
This indicator analyzes trends with Heikin-ashi Ass and EMA to buy and sell, and closes positions by analyzing patterns of Bollinger bands and candles.
The numbers at the top and bottom of the indicator are the RSI values.
Only overbought 30 or less and oversold 70 or more are displayed.
이 지표는 하이킨아시와 EMA로 트랜드를 분석하여 매수와 매도 진입을 하고 볼린저밴드와 캔들의 패턴을 분석하여 포지션종료를 합니다.
지표의 상단과 하단에 표시된 숫자는 RSI값입니다.
과매수 30이하와 과매도 70이상만 표시합니다.
發行說明
modify long and short entry and long and short close condition롱숏진입조건과 롱숏청산조건을 수정
發行說明
Add Show/Hide Long Short Check發行說明
Modified Display Color免責聲明
這些資訊和出版物並不意味著也不構成TradingView提供或認可的金融、投資、交易或其他類型的意見或建議。請在使用條款閱讀更多資訊。