OPEN-SOURCE SCRIPT
已更新 Isolated Peak and Bottom (Tuncer ŞENGÖZ) by KıvanÇ fr3762
This Technique is created by Tuncer Şengöz @TuncerSengoz on twitter
An uptrend with higher highs might not make new highs everyday. So how could we define the end of an uptrend? How could we tell the difference between the end of an uptrend and a temporary correction? This isolated high/low technique aims to help us in this kind of situations.
We call the highest point of an uptrend until the particular day “an isolated Peak” and consider the lowest point of the day before as a signal level. If the signal level is broken in 2 days, we assume the uptrend to be over. If it is not broken in 2 days, the uptrend continues. The same technique also applies to a downtrend and the only difference would be the direction.
conversely it has the same logic of finding an end of a downtrend, called "Isolated Bottom" which can be considered the highest point of the day before as a signal level the same way.
The success rate of this technique is quite high (around 85%). There is no required term for this technique and it can be used in yearly, daily or ticker charts, because the market moves in fractals and repeats itself in every scale.
As in every technique, it might also give false signals in some situations like extreme volatility or emotional decisions of masses. However, it will be very helpful for us to indicate the direction of a trend.
Creator: Tuncer ŞENGÖZ @TuncerSengoz on twitter
發行說明
formula updated發行說明
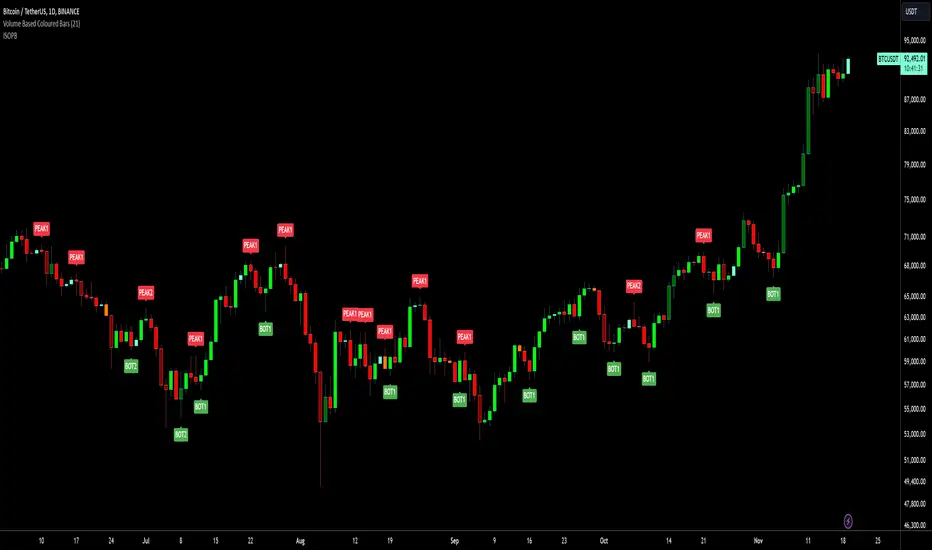
PEAK1: Isolated Peak conditions occured 1 bar after the peakPEAK2: Isolated Peak conditions occured 2 bars after the peak
BOT1: Isolated Bottom conditions occured 1 bar after the bottom
BOT2: Isolated Bottom conditions occured 2 bars after the bottom
發行說明
addded alarms and code updated to V6開源腳本
秉持TradingView一貫精神,這個腳本的創作者將其設為開源,以便交易者檢視並驗證其功能。向作者致敬!您可以免費使用此腳本,但請注意,重新發佈代碼需遵守我們的社群規範。
Telegram t.me/AlgoRhytm
YouTube (Turkish): youtube.com/c/kivancozbilgic
YouTube (English): youtube.com/c/AlgoWorld
YouTube (Turkish): youtube.com/c/kivancozbilgic
YouTube (English): youtube.com/c/AlgoWorld
免責聲明
這些資訊和出版物並非旨在提供,也不構成TradingView提供或認可的任何形式的財務、投資、交易或其他類型的建議或推薦。請閱讀使用條款以了解更多資訊。
開源腳本
秉持TradingView一貫精神,這個腳本的創作者將其設為開源,以便交易者檢視並驗證其功能。向作者致敬!您可以免費使用此腳本,但請注意,重新發佈代碼需遵守我們的社群規範。
Telegram t.me/AlgoRhytm
YouTube (Turkish): youtube.com/c/kivancozbilgic
YouTube (English): youtube.com/c/AlgoWorld
YouTube (Turkish): youtube.com/c/kivancozbilgic
YouTube (English): youtube.com/c/AlgoWorld
免責聲明
這些資訊和出版物並非旨在提供,也不構成TradingView提供或認可的任何形式的財務、投資、交易或其他類型的建議或推薦。請閱讀使用條款以了解更多資訊。