OPEN-SOURCE SCRIPT
Dot trader
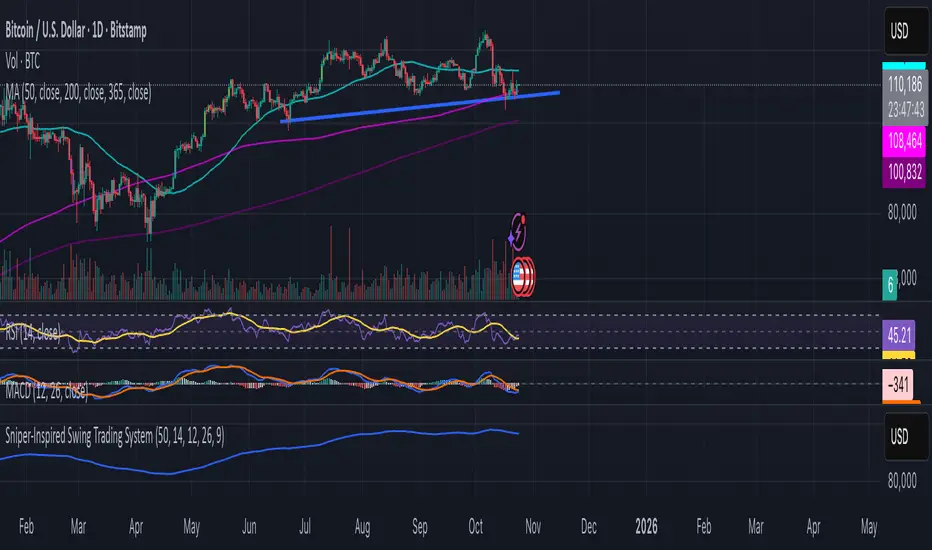
Interpret Signals: Green triangles indicate buy (e.g., if BTC holds $109k with bullish crossover); red triangles indicate sell (e.g., if it breaks $108k with bearish divergence).
Candle Colors: Green/bullish, red/bearish, orange/overbought (>70 RSI), blue/oversold (<30 RSI).
Alerts: Enable in TradingView for real-time notifications.
Candle Colors: Green/bullish, red/bearish, orange/overbought (>70 RSI), blue/oversold (<30 RSI).
Alerts: Enable in TradingView for real-time notifications.
開源腳本
秉持TradingView一貫精神,這個腳本的創作者將其設為開源,以便交易者檢視並驗證其功能。向作者致敬!您可以免費使用此腳本,但請注意,重新發佈代碼需遵守我們的社群規範。
免責聲明
這些資訊和出版物並非旨在提供,也不構成TradingView提供或認可的任何形式的財務、投資、交易或其他類型的建議或推薦。請閱讀使用條款以了解更多資訊。
開源腳本
秉持TradingView一貫精神,這個腳本的創作者將其設為開源,以便交易者檢視並驗證其功能。向作者致敬!您可以免費使用此腳本,但請注意,重新發佈代碼需遵守我們的社群規範。
免責聲明
這些資訊和出版物並非旨在提供,也不構成TradingView提供或認可的任何形式的財務、投資、交易或其他類型的建議或推薦。請閱讀使用條款以了解更多資訊。