OPEN-SOURCE SCRIPT
Buy/Sell Break and Retest
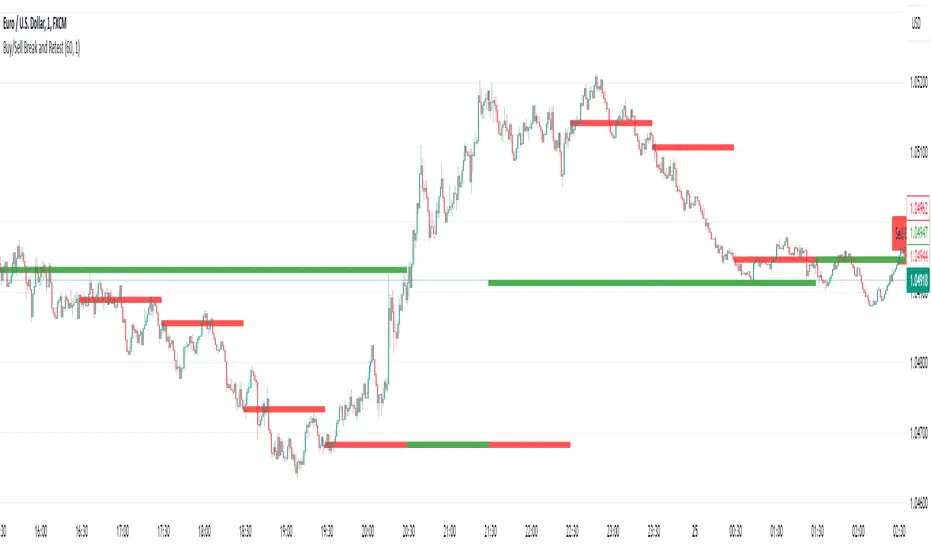
This script is a Pine Script indicator for TradingView titled **"Buy/Sell Break and Retest"**. Here's a description of its functionality:
### Purpose:
The script identifies potential **buy** and **sell entry levels** based on break-and-retest patterns in the market. It works by analyzing higher timeframe data (e.g., 1-hour) and marking entries on a lower timeframe (e.g., 1-minute).
### Key Features:
1. **Configurable Timeframes**:
- `Analysis Timeframe`: Used for identifying break-and-retest signals (default: 1-hour).
- `Entry Timeframe`: Used for marking and plotting entries (default: 1-minute).
2. **Buy and Sell Signals**:
- A **sell entry** is triggered when a bearish candle (close < open) is identified in the analysis timeframe.
- A **buy entry** is triggered when a bullish candle (close > open) is identified in the analysis timeframe.
3. **Retest Logic**:
- For sell signals: The retest is validated when the price breaks below the identified sell level.
- For buy signals: The retest is validated when the price breaks above the identified buy level.
4. **Visual Indicators**:
- Entry levels are marked with labels:
- **Buy Entry**: Green labels are placed at bullish candle opens.
- **Sell Entry**: Red labels are placed at bearish candle closes.
- Plots the levels for easy reference:
- **Sell Level**: Displayed as red circles on the chart.
- **Buy Level**: Displayed as green circles on the chart.
5. **Dynamic Updates**:
- Levels are cleared when invalidated by the price action.
### Use Case:
This indicator helps traders spot break-and-retest opportunities by:
- Allowing higher timeframe analysis to determine trend direction and key levels.
- Providing actionable buy and sell entry points on lower timeframes for precision.
Let me know if you'd like further clarification or improvements!
開源腳本
秉持TradingView一貫精神,這個腳本的創作者將其設為開源,以便交易者檢視並驗證其功能。向作者致敬!您可以免費使用此腳本,但請注意,重新發佈代碼需遵守我們的社群規範。
免責聲明
這些資訊和出版物並非旨在提供,也不構成TradingView提供或認可的任何形式的財務、投資、交易或其他類型的建議或推薦。請閱讀使用條款以了解更多資訊。
開源腳本
秉持TradingView一貫精神,這個腳本的創作者將其設為開源,以便交易者檢視並驗證其功能。向作者致敬!您可以免費使用此腳本,但請注意,重新發佈代碼需遵守我們的社群規範。
免責聲明
這些資訊和出版物並非旨在提供,也不構成TradingView提供或認可的任何形式的財務、投資、交易或其他類型的建議或推薦。請閱讀使用條款以了解更多資訊。