OPEN-SOURCE SCRIPT
已更新 Inflation Rate of Change

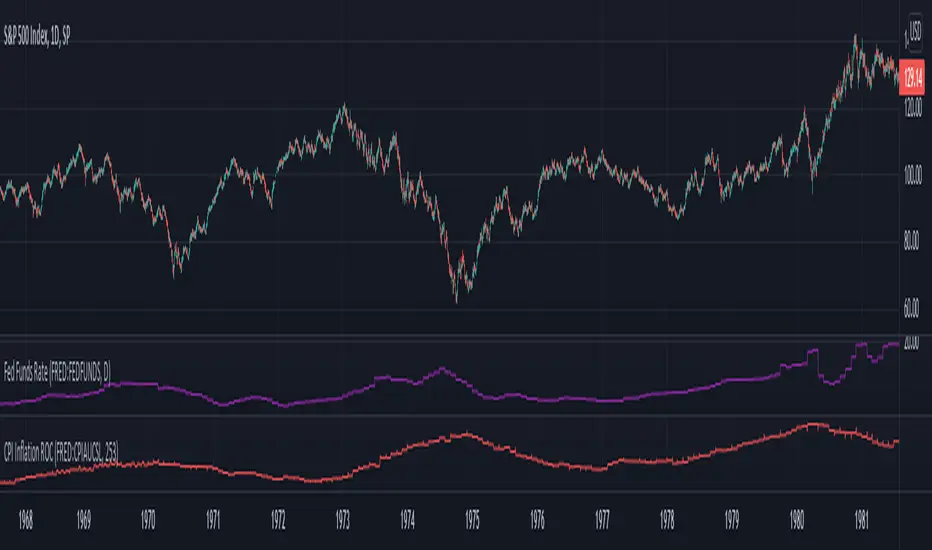
Inflation and the Fed interest rate impacts all corners of the economy. Today I am releasing to the community an indicator that measures the rate of change of inflation with historical data back to ~1950. I built this to study the historical market impacts of inflation and changes to the Fed rate (see separate indicator I published for Fed Funds Rate here).
What this indicator does:
This indicator pulls in Consumer Price Index data and applies a rate of change formula to it. The output is measured as a percentage. I.e. 7 would mean a 7% rate of change over the look-back period.
Options in the indicator:
You can change the amount of bars back it uses to calculate rate of change. By default it is set to 253, which would be looking 1 year back on a normal stock market day chart. If you are on a month chart, you would input 12 there to look 1 year back, etc.
There are also different versions of the CPI that you can select with a drop-down input to pull in different inflation measures:
Disclaimer: Open-source scripts I publish in the community are largely meant to spark ideas that can be used as building blocks for part of a more robust trade management strategy. If you would like to implement a version of any script, I would recommend making significant additions/modifications to the strategy & risk management functions. If you don’t know how to program in Pine, then hire a Pine-coder. We can help!
What this indicator does:
This indicator pulls in Consumer Price Index data and applies a rate of change formula to it. The output is measured as a percentage. I.e. 7 would mean a 7% rate of change over the look-back period.
Options in the indicator:
You can change the amount of bars back it uses to calculate rate of change. By default it is set to 253, which would be looking 1 year back on a normal stock market day chart. If you are on a month chart, you would input 12 there to look 1 year back, etc.
There are also different versions of the CPI that you can select with a drop-down input to pull in different inflation measures:
- FRED:CPIAUCSL = Urban Consumers, All Items (this is the default data it pulls, and is a common way to measure inflation)
- FRED:CPIUFDNS = Food
- FRED:CPIHOSNS = Housing
- FRED:CPIENGSL = Energy
Disclaimer: Open-source scripts I publish in the community are largely meant to spark ideas that can be used as building blocks for part of a more robust trade management strategy. If you would like to implement a version of any script, I would recommend making significant additions/modifications to the strategy & risk management functions. If you don’t know how to program in Pine, then hire a Pine-coder. We can help!
發行說明
Update: Added additional CPI / inflation measures that can be selected from a drop-down menu. Now includes: All Items, Food, Housing, Energy, Medical and Apparel.開源腳本
秉持TradingView一貫精神,這個腳本的創作者將其設為開源,以便交易者檢視並驗證其功能。向作者致敬!您可以免費使用此腳本,但請注意,重新發佈代碼需遵守我們的社群規範。
Want to build custom alerts and custom strategies? Interested in automated trading?
Hire me to code or automate your trading strategy, or schedule a free consultation at:
TradeAutomation.net
Hire me to code or automate your trading strategy, or schedule a free consultation at:
TradeAutomation.net
免責聲明
這些資訊和出版物並非旨在提供,也不構成TradingView提供或認可的任何形式的財務、投資、交易或其他類型的建議或推薦。請閱讀使用條款以了解更多資訊。
開源腳本
秉持TradingView一貫精神,這個腳本的創作者將其設為開源,以便交易者檢視並驗證其功能。向作者致敬!您可以免費使用此腳本,但請注意,重新發佈代碼需遵守我們的社群規範。
Want to build custom alerts and custom strategies? Interested in automated trading?
Hire me to code or automate your trading strategy, or schedule a free consultation at:
TradeAutomation.net
Hire me to code or automate your trading strategy, or schedule a free consultation at:
TradeAutomation.net
免責聲明
這些資訊和出版物並非旨在提供,也不構成TradingView提供或認可的任何形式的財務、投資、交易或其他類型的建議或推薦。請閱讀使用條款以了解更多資訊。