OPEN-SOURCE SCRIPT
Mswing Homma

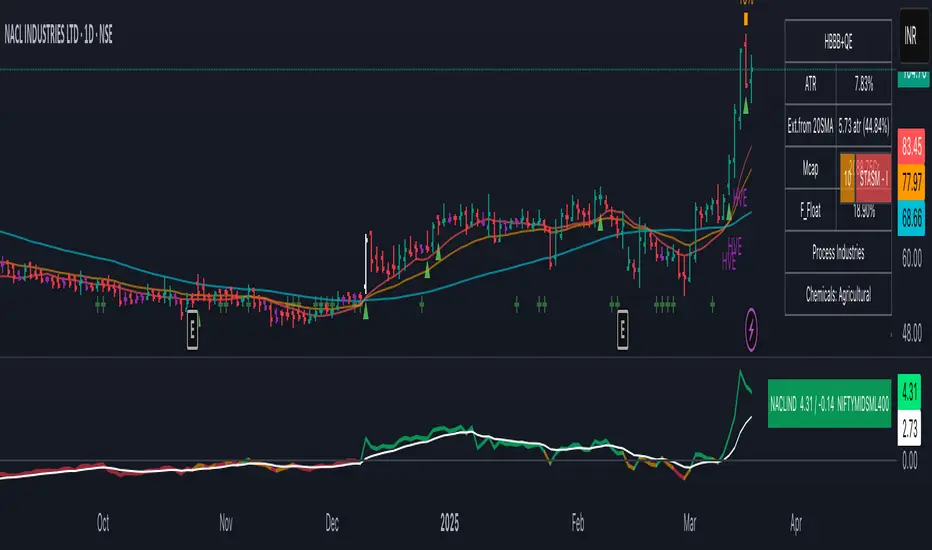
The Mswing is a momentum oscillator that calculates the rate of price change over 20 and 50 periods (days/weeks). Apart from quantifying momentum, it can be used for assessing relative strength, sectoral rotation & entry/exit signals.
Quantifying Momentum Strength
The Mswing's relationship with its EMA (e.g., 5-period or 9-period) is used for momentum analysis:
• M Swing >0 and Above EMA: Momentum is positive and accelerating (ideal for entries).
• M Swing >0 and Below EMA: Momentum is positive but decelerating (caution).
• M Swing <0 and Above EMA: Momentum is negative but improving (watch for reversals).
• M Swing <0 and Below EMA: Momentum is negative and worsening (exit or avoid).
Relative Strength Scanning (M Score)
Sort stocks by their M Swing using TradingView’s Pine scanner.
Compare the Mswing scores of indices/sectors to allocate capital to stronger groups (e.g., renewables vs. traditional energy).
Stocks with strong Mswing scores tend to outperform during bullish phases, while weak ones collapse faster in downtrends.
Entry and Exit Signals
Entry: Buy when Mswing crosses above 0 + price breaks key moving averages (50-day SMA). Use Mswing >0 to confirm valid breakouts. Buy dips when Mswing holds above EMA during retracements.
Exit: Mswing can be used for exiting a stock in 2 ways:
• Sell in Strength: Mswing >4 (overbought).
• Sell in Weakness: Mswing <0 + price below 50-day SMA.
Multi-Timeframe Analysis
• Daily: For swing trades.
• Weekly: For trend confirmation.
• Monthly: For long-term portfolio adjustments.
開源腳本
秉持TradingView一貫精神,這個腳本的創作者將其設為開源,以便交易者檢視並驗證其功能。向作者致敬!您可以免費使用此腳本,但請注意,重新發佈代碼需遵守我們的社群規範。
免責聲明
這些資訊和出版物並非旨在提供,也不構成TradingView提供或認可的任何形式的財務、投資、交易或其他類型的建議或推薦。請閱讀使用條款以了解更多資訊。
開源腳本
秉持TradingView一貫精神,這個腳本的創作者將其設為開源,以便交易者檢視並驗證其功能。向作者致敬!您可以免費使用此腳本,但請注意,重新發佈代碼需遵守我們的社群規範。
免責聲明
這些資訊和出版物並非旨在提供,也不構成TradingView提供或認可的任何形式的財務、投資、交易或其他類型的建議或推薦。請閱讀使用條款以了解更多資訊。