OPEN-SOURCE SCRIPT
Volume candle by Moond
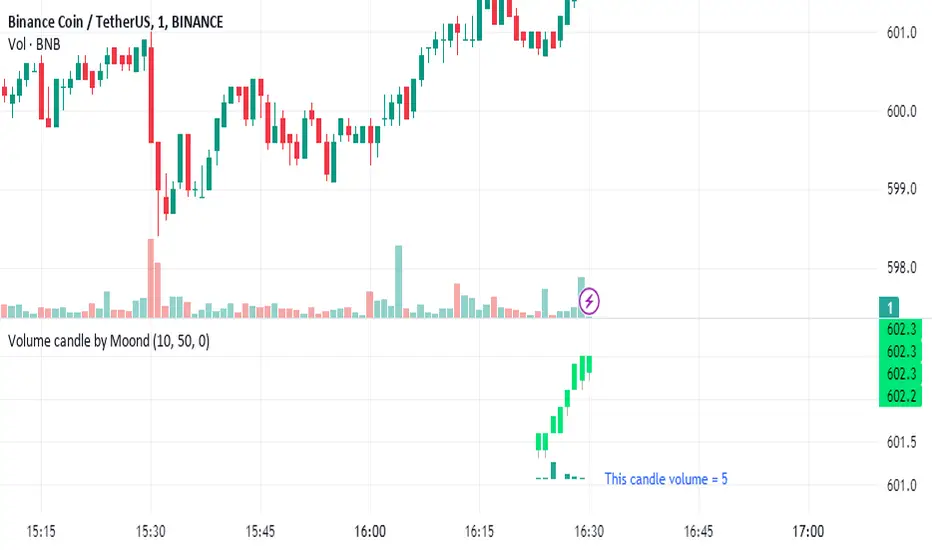
Indicator Description: Equal Volume Candle Chart
This indicator creates a real-time candlestick chart where each candle forms upon the completion of a specific volume threshold, rather than within fixed time intervals. The candles update dynamically based on the total volume traded, providing a unique perspective that incorporates market activity directly into price movements.
Key Features:
Dynamic Candles Based on Volume: Candles form when a defined lot size of volume is reached, making each candle represent consistent trading activity rather than a fixed time period.
Customizable Volume Lot Size: Users can easily adjust the volume threshold to suit different trading styles or asset classes.
Real-Time Market Reflection: The chart responds to changes in market volume, offering a clearer view of market intensity and momentum.
Concept Behind the Indicator: Traditional candlestick charts operate on time intervals, which can ignore the influence of volume in price changes. By basing the candle formation on equal volumes, this indicator integrates both price and traded volume into the visual representation, helping traders capture key shifts in market sentiment and activity that might be missed on time-based charts
開源腳本
秉持TradingView一貫精神,這個腳本的創作者將其設為開源,以便交易者檢視並驗證其功能。向作者致敬!您可以免費使用此腳本,但請注意,重新發佈代碼需遵守我們的社群規範。
免責聲明
這些資訊和出版物並非旨在提供,也不構成TradingView提供或認可的任何形式的財務、投資、交易或其他類型的建議或推薦。請閱讀使用條款以了解更多資訊。
開源腳本
秉持TradingView一貫精神,這個腳本的創作者將其設為開源,以便交易者檢視並驗證其功能。向作者致敬!您可以免費使用此腳本,但請注意,重新發佈代碼需遵守我們的社群規範。
免責聲明
這些資訊和出版物並非旨在提供,也不構成TradingView提供或認可的任何形式的財務、投資、交易或其他類型的建議或推薦。請閱讀使用條款以了解更多資訊。