OPEN-SOURCE SCRIPT
Fibonacci Bands [BigBeluga]
The Fibonacci Band indicator is a powerful tool for identifying potential support, resistance, and mean reversion zones based on Fibonacci ratios. It overlays three sets of Fibonacci ratio bands (38.2%, 61.8%, and 100%) around a central trend line, dynamically adapting to price movements. This structure enables traders to track trends, visualize potential liquidity sweep areas, and spot reversal points for strategic entries and exits.

🔵 KEY FEATURES & USAGE
🔵 CUSTOMIZATION
The Fibonacci Band indicator provides traders with an advanced framework for analyzing market structure, liquidity sweeps, and trend reversals. By integrating Fibonacci-based levels with trend detection and mean reversion signals, this tool offers a robust approach to navigating dynamic price action and finding high-probability trading opportunities.
🔵 KEY FEATURES & USAGE
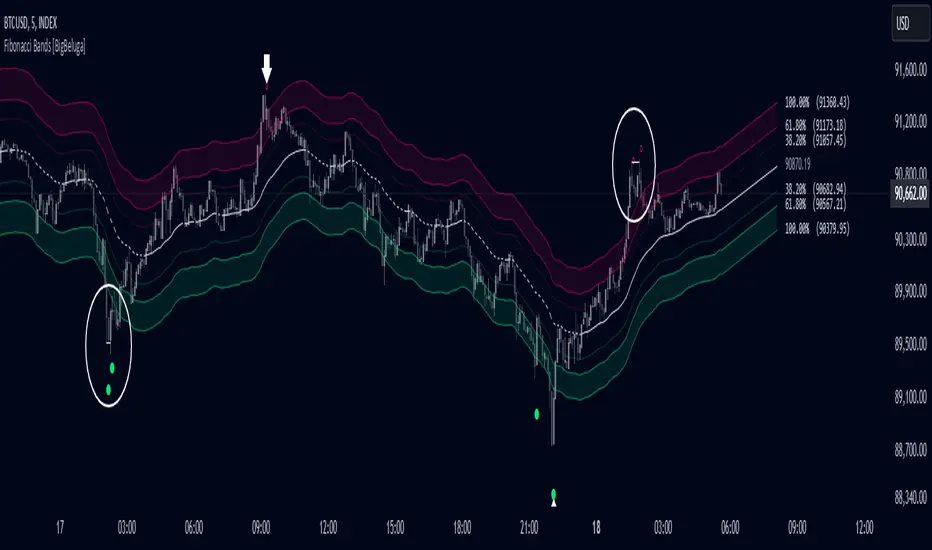
- Fibonacci Bands for Support & Resistance:
The Fibonacci Band indicator applies three key Fibonacci ratios (38.2%, 61.8%, and 100%) to construct dynamic bands around a smoothed price. These levels often act as critical support and resistance areas, marked with labels displaying the percentage and corresponding price. The 100% band level is especially crucial, signaling potential liquidity sweep zones and reversal points. - Mean Reversion Signals at 100% Bands:
When price moves above or below the 100% band, the indicator generates mean reversion signals. - Trend Detection with Midline:
The central line acts as a trend-following tool: when solid, it indicates an uptrend, while a dashed line signals a downtrend. This adaptive midline helps traders assess the prevailing market direction while keeping the chart clean and intuitive. - Extended Price Projections:
All Fibonacci bands extend to future bars (default 30) to project potential price levels, providing a forward-looking perspective on where price may encounter support or resistance. This feature helps traders anticipate market structure in advance and set targets accordingly. - Liquidity Sweep:
--
-Liquidity Sweep at Previous Lows:
The price action moves below a previous low, capturing sell-side liquidity (stop-losses from long positions or entries for breakout traders).
The wick suggests that the price quickly reversed, leaving a failed breakout below support.
This is a classic liquidity grab, often indicating a bullish reversal.
-Liquidity Sweep at Previous Highs:
The price spikes above a prior high, sweeping buy-side liquidity (stop-losses from short positions or breakout entries).
The wick signifies rejection, suggesting a failed breakout above resistance.
This is a bearish liquidity sweep, often followed by a mean reversion or a downward move. - Display Customization:
To declutter the chart, traders can choose to hide Fibonacci levels and only display overbought/oversold zones along with the trend-following midline and mean reversion signals. This option enables a clearer focus on key reversal areas without additional distractions.
🔵 CUSTOMIZATION
- Period Length: Adjust the length of the smoothed moving average for more reactive or smoother bands.
- Channel Width: Customize the width of the Fibonacci channel.
- Fibonacci Ratios: Customize the Fibonacci ratios to reflect personal preference or unique market behaviors.
- Future Projection Extension: Set the number of bars to extend Fibonacci bands, allowing flexibility in projecting price levels.
- Hide Fibonacci Levels: Toggle the visibility of Fibonacci levels for a cleaner chart focused on overbought/oversold regions and midline trend signals.
- Liquidity Sweep: Toggle the visibility of Liquidity Sweep points
The Fibonacci Band indicator provides traders with an advanced framework for analyzing market structure, liquidity sweeps, and trend reversals. By integrating Fibonacci-based levels with trend detection and mean reversion signals, this tool offers a robust approach to navigating dynamic price action and finding high-probability trading opportunities.
開源腳本
秉持TradingView一貫精神,這個腳本的創作者將其設為開源,以便交易者檢視並驗證其功能。向作者致敬!您可以免費使用此腳本,但請注意,重新發佈代碼需遵守我們的社群規範。
🔵Gain access to our powerful tools : bigbeluga.com/tv
🔵Join our free discord for updates : bigbeluga.com/discord
All scripts & content provided by BigBeluga are for informational & educational purposes only.
🔵Join our free discord for updates : bigbeluga.com/discord
All scripts & content provided by BigBeluga are for informational & educational purposes only.
免責聲明
這些資訊和出版物並非旨在提供,也不構成TradingView提供或認可的任何形式的財務、投資、交易或其他類型的建議或推薦。請閱讀使用條款以了解更多資訊。