OPEN-SOURCE SCRIPT
SmartMind2
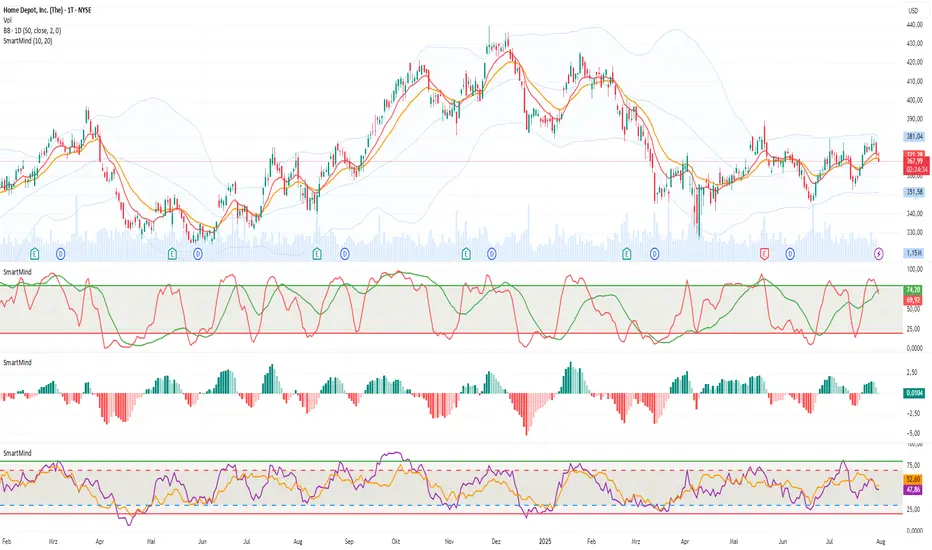
The MACD (Moving Average Convergence Divergence) is a popular technical indicator in trading, primarily used to detect trends and possible reversal points.
How is the MACD structured?
The MACD indicator consists of three components:
MACD Line:
Calculated as the difference between two exponential moving averages (EMAs), commonly 12 and 26 periods.
Formula:
MACD Line
=
𝐸
𝑀
𝐴
12
(
Price
)
−
𝐸
𝑀
𝐴
26
(
Price
)
MACD Line=EMA
12
(Price)−EMA
26
(Price)
Signal Line:
An exponential moving average (usually 9 periods) of the MACD line.
Formula:
Signal Line
=
𝐸
𝑀
𝐴
9
(
MACD Line
)
Signal Line=EMA
9
(MACD Line)
Histogram:
Graphically represents the difference between the MACD line and the Signal line.
Formula:
Histogram
=
MACD Line
−
Signal Line
Histogram=MACD Line−Signal Line
Interpretation of MACD:
Buy Signal: Occurs when the MACD line crosses above the signal line (bullish signal).
Sell Signal: Occurs when the MACD line crosses below the signal line (bearish signal).
Trend Reversal: A divergence between price movements and the MACD indicates a potential reversal (e.g., rising prices with a falling MACD).
開源腳本
秉持TradingView一貫精神,這個腳本的創作者將其設為開源,以便交易者檢視並驗證其功能。向作者致敬!您可以免費使用此腳本,但請注意,重新發佈代碼需遵守我們的社群規範。
免責聲明
這些資訊和出版物並非旨在提供,也不構成TradingView提供或認可的任何形式的財務、投資、交易或其他類型的建議或推薦。請閱讀使用條款以了解更多資訊。
開源腳本
秉持TradingView一貫精神,這個腳本的創作者將其設為開源,以便交易者檢視並驗證其功能。向作者致敬!您可以免費使用此腳本,但請注意,重新發佈代碼需遵守我們的社群規範。
免責聲明
這些資訊和出版物並非旨在提供,也不構成TradingView提供或認可的任何形式的財務、投資、交易或其他類型的建議或推薦。請閱讀使用條款以了解更多資訊。