OPEN-SOURCE SCRIPT
已更新 MA and Channel overlay
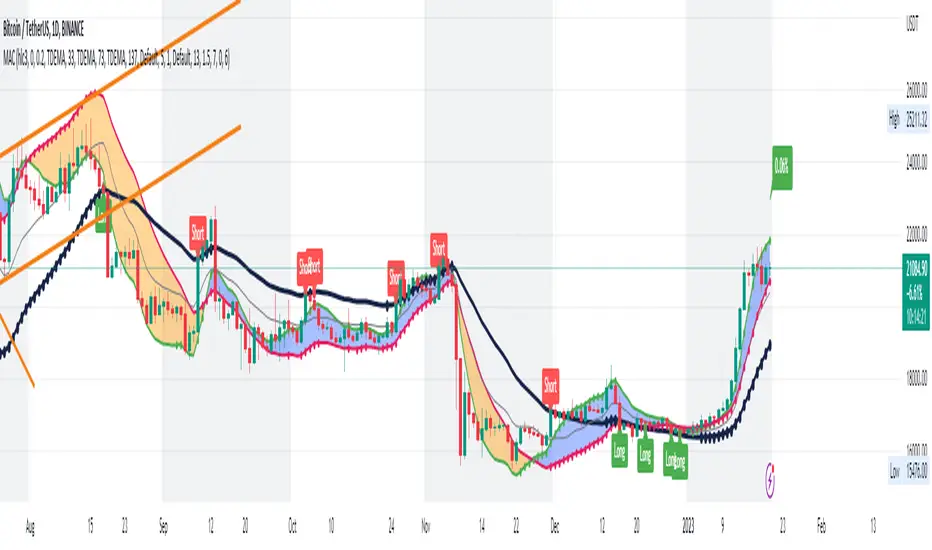
Some overlay utilities:
- Draw 3 moving averages (MA) with circles line.
- Option to choose type of MA to plot.
- Draw start point of those MA with a big cross.
- Option to draw channel: Donchian, Bollinger and Envelope.
- Option to draw stop loss line: ATR or Percentage.
- Draw background color in monthly, weekly, daily, intraday, ... chart (remember to choose your correct timezone if using intraday chart).
- Draw a label of last price.
- Draw next prices.
發行說明
Added comments and showed stop loss line for demo purpose.發行說明
Option to show / hide MAs.發行說明
New chart view.發行說明
Add intraday labels which show day number in month and weekday name.發行說明
Add hour range to draw sleep time in intraday chart.發行說明
Fixed time zone issue for exchange that has non-UTC timezone.發行說明
Fix weekly background issue.發行說明
Fix channel len issue.發行說明
- Use TDEMA as the default MA now.- Use bigger periods to catch trend easier.
- Drawed a band between small and medium period (MA1 and MA2) lines.
- The position of this band and the big period line (MA3) is the key to check the trend now.
開源腳本
秉持TradingView一貫精神,這個腳本的創作者將其設為開源,以便交易者檢視並驗證其功能。向作者致敬!您可以免費使用此腳本,但請注意,重新發佈代碼需遵守我們的社群規範。
免責聲明
這些資訊和出版物並非旨在提供,也不構成TradingView提供或認可的任何形式的財務、投資、交易或其他類型的建議或推薦。請閱讀使用條款以了解更多資訊。
開源腳本
秉持TradingView一貫精神,這個腳本的創作者將其設為開源,以便交易者檢視並驗證其功能。向作者致敬!您可以免費使用此腳本,但請注意,重新發佈代碼需遵守我們的社群規範。
免責聲明
這些資訊和出版物並非旨在提供,也不構成TradingView提供或認可的任何形式的財務、投資、交易或其他類型的建議或推薦。請閱讀使用條款以了解更多資訊。