OPEN-SOURCE SCRIPT
已更新 Price Clouds (PS)
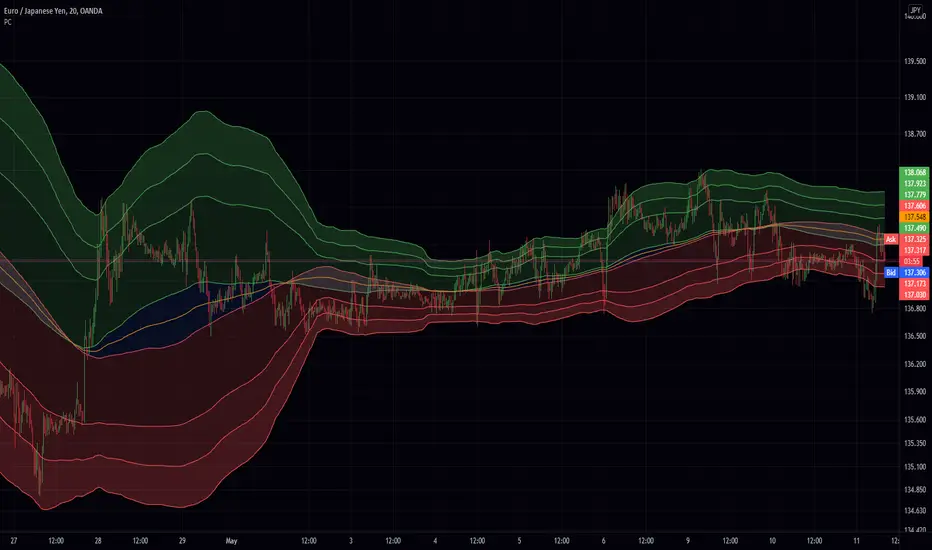
Price could shows you dynamic support resistance levels. It also displays two bands (ie clouds) that show you where the trend is. If the price hits the bottom of the high band thats a buy and if it hits the top of the high band its a sell. During times of volatility the price can break support but you will find that the opposite band will work as the next level. I added tool tips for every option to help explain what everything does and I also left suggestions for other settings.
This works great on everything! That being said I have this setup in a general way that works really well for 20m forex. If you are scalping you might want to speed up the indicator. This is also true if you want go to the daily chart or above. Adjust the Stdev to match the market.. and I mean really play around with.. dont be shy! With all that out of the way this really will work out of the box. If you like this indicator its actually the same thing as my (PBS) but this one is an overlay on the chart. (Also as of publishing this script the code for this version is way cleaner. In fact I plan on replacing PBS with this as its base)
If you find this indicator is useful to you, Star it, Follow, Donate, Like and Share.
Your support is a highly motivation for me.
發行說明
Quick fix on the chart發行說明
chart should be fixed for real 發行說明
tool tip update發行說明
Major update that over doubles the power of the study. Twice the lines making the clouds work way better. 6 ma's where added: TMA, WMA, HALMA, SMMA, VWMA, and GMA.發行說明
tool tip update發行說明
quick fix with input order lol發行說明
Fixed input order (now that its not the middle of the "next morning" lol)發行說明
Added mean line and background.發行說明
Actually fixed input order. Updated tool tips. Added KAMA and fixed Smoothed Moving Average "smma". Updated default setting. Updated bg colours. 發行說明
oscillator version found here 
發行說明
Greatly improved controls.發行說明
chart發行說明
Thank you發行說明
Redone from the ground up. Added Geometric STDV.發行說明
mild update發行說明
removed a broken ma發行說明
I should go to bed before updating lol發行說明
this should be a stable release now 發行說明
fixed a small hickup with the default bottom source開源腳本
秉持TradingView一貫精神,這個腳本的創作者將其設為開源,以便交易者檢視並驗證其功能。向作者致敬!您可以免費使用此腳本,但請注意,重新發佈代碼需遵守我們的社群規範。
免責聲明
這些資訊和出版物並非旨在提供,也不構成TradingView提供或認可的任何形式的財務、投資、交易或其他類型的建議或推薦。請閱讀使用條款以了解更多資訊。
開源腳本
秉持TradingView一貫精神,這個腳本的創作者將其設為開源,以便交易者檢視並驗證其功能。向作者致敬!您可以免費使用此腳本,但請注意,重新發佈代碼需遵守我們的社群規範。
免責聲明
這些資訊和出版物並非旨在提供,也不構成TradingView提供或認可的任何形式的財務、投資、交易或其他類型的建議或推薦。請閱讀使用條款以了解更多資訊。