OPEN-SOURCE SCRIPT
Daily Percent Change Label
Daily Percent Change Label
Overview
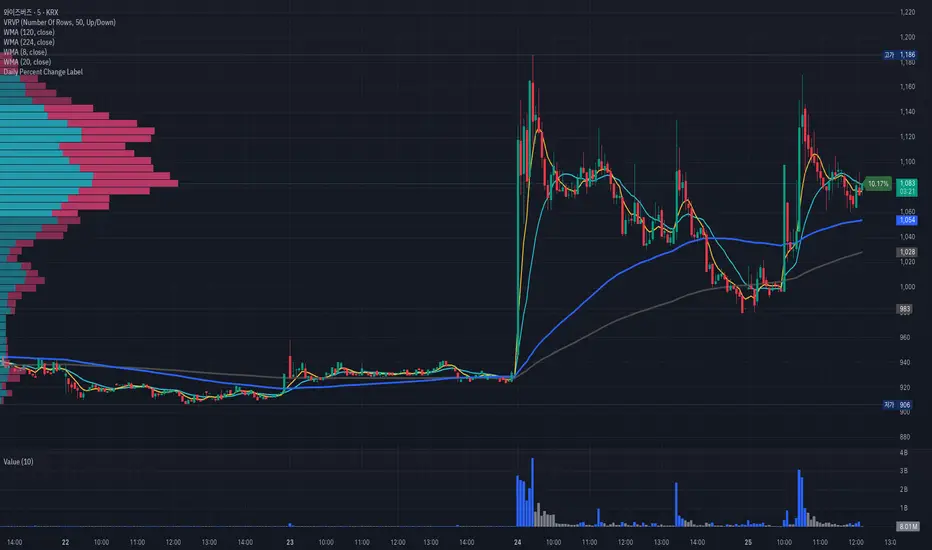
This Pine Script displays the percentage change from the previous day's closing price as a text label near the current price level on the chart. It works seamlessly across any timeframe (daily, hourly, minute charts) by referencing the daily chart's previous close, making it perfect for traders tracking daily performance.
The label is displayed with a semi-transparent background (green for positive changes, red for negative changes) and white text, ensuring a clean and readable appearance.
Features
Accurate Daily Percent Change: Calculates the percentage change based on the previous day's closing price, even on intraday timeframes (e.g., 1-hour, 5-minute).
Dynamic Label: Shows the percentage change as a label aligned with the current price, updating in real-time.
Color-Coded Background: Semi-transparent green background for positive changes and red for negative changes.
Customizable: Adjust label position, size, color, and style to fit your preferences.
Minimal Impact: No additional plots or graphs, keeping the chart uncluttered.
How to Use
Add the Script:
Copy and paste the script into the Pine Editor in TradingView.
Click "Add to Chart" to apply it.
Check the Output:
A text label (e.g., "+2.34%" or "-1.56%") appears near the current price with a semi-transparent background.
The label is colored green (positive) or red (negative) and updates in real-time.
Switch Timeframes:
Works on any timeframe. The percentage change is always calculated relative to the previous day's close.
Customization Options
Modify the label.new function to customize the label:
Label Position:
Change style=label.style_label_left to label.style_label_right or label.style_label_down to adjust label placement.
Adjust bar_index with an offset (e.g., bar_index + 1) to move the label horizontally.
Text Color:
Modify textcolor=color.white to another color (e.g., color.rgb(255, 255, 0) for yellow).
Background Color:
Adjust color=percent_change >= 0 ? color.new(color.green, 50) : color.new(color.red, 50) to change transparency (e.g., color.new(color.green, 0) for no transparency).
Text Size:
Change size=size.normal to size.small or size.large for smaller or larger text.
Code Details
Timeframe Handling: Uses request.security with the "D" timeframe to fetch the previous day's closing price, ensuring accuracy on intraday charts.
Performance: Updates only on the last bar (barstate.islast) for optimal performance.
Dynamic Styling: Background color changes based on the direction of the price change.
Notes
The label is positioned near the current price for easy reference. To move it closer to the Y-axis, adjust the bar_index offset.
For different reference points (e.g., weekly close), modify the request.security timeframe (e.g., "W" for weekly).
Ensure the script is copied correctly without extra spaces or characters. Use a plain text editor (e.g., Notepad) for copying.
Feedback
Please share your feedback or customizations in the comments! If you find this script helpful, give it a thumbs-up or let others know how you're using it. Happy trading!
Overview
This Pine Script displays the percentage change from the previous day's closing price as a text label near the current price level on the chart. It works seamlessly across any timeframe (daily, hourly, minute charts) by referencing the daily chart's previous close, making it perfect for traders tracking daily performance.
The label is displayed with a semi-transparent background (green for positive changes, red for negative changes) and white text, ensuring a clean and readable appearance.
Features
Accurate Daily Percent Change: Calculates the percentage change based on the previous day's closing price, even on intraday timeframes (e.g., 1-hour, 5-minute).
Dynamic Label: Shows the percentage change as a label aligned with the current price, updating in real-time.
Color-Coded Background: Semi-transparent green background for positive changes and red for negative changes.
Customizable: Adjust label position, size, color, and style to fit your preferences.
Minimal Impact: No additional plots or graphs, keeping the chart uncluttered.
How to Use
Add the Script:
Copy and paste the script into the Pine Editor in TradingView.
Click "Add to Chart" to apply it.
Check the Output:
A text label (e.g., "+2.34%" or "-1.56%") appears near the current price with a semi-transparent background.
The label is colored green (positive) or red (negative) and updates in real-time.
Switch Timeframes:
Works on any timeframe. The percentage change is always calculated relative to the previous day's close.
Customization Options
Modify the label.new function to customize the label:
Label Position:
Change style=label.style_label_left to label.style_label_right or label.style_label_down to adjust label placement.
Adjust bar_index with an offset (e.g., bar_index + 1) to move the label horizontally.
Text Color:
Modify textcolor=color.white to another color (e.g., color.rgb(255, 255, 0) for yellow).
Background Color:
Adjust color=percent_change >= 0 ? color.new(color.green, 50) : color.new(color.red, 50) to change transparency (e.g., color.new(color.green, 0) for no transparency).
Text Size:
Change size=size.normal to size.small or size.large for smaller or larger text.
Code Details
Timeframe Handling: Uses request.security with the "D" timeframe to fetch the previous day's closing price, ensuring accuracy on intraday charts.
Performance: Updates only on the last bar (barstate.islast) for optimal performance.
Dynamic Styling: Background color changes based on the direction of the price change.
Notes
The label is positioned near the current price for easy reference. To move it closer to the Y-axis, adjust the bar_index offset.
For different reference points (e.g., weekly close), modify the request.security timeframe (e.g., "W" for weekly).
Ensure the script is copied correctly without extra spaces or characters. Use a plain text editor (e.g., Notepad) for copying.
Feedback
Please share your feedback or customizations in the comments! If you find this script helpful, give it a thumbs-up or let others know how you're using it. Happy trading!
開源腳本
秉持TradingView一貫精神,這個腳本的創作者將其設為開源,以便交易者檢視並驗證其功能。向作者致敬!您可以免費使用此腳本,但請注意,重新發佈代碼需遵守我們的社群規範。
免責聲明
這些資訊和出版物並非旨在提供,也不構成TradingView提供或認可的任何形式的財務、投資、交易或其他類型的建議或推薦。請閱讀使用條款以了解更多資訊。
開源腳本
秉持TradingView一貫精神,這個腳本的創作者將其設為開源,以便交易者檢視並驗證其功能。向作者致敬!您可以免費使用此腳本,但請注意,重新發佈代碼需遵守我們的社群規範。
免責聲明
這些資訊和出版物並非旨在提供,也不構成TradingView提供或認可的任何形式的財務、投資、交易或其他類型的建議或推薦。請閱讀使用條款以了解更多資訊。