OPEN-SOURCE SCRIPT
SMA+デマンド・オファーゾーン最強版(仮)
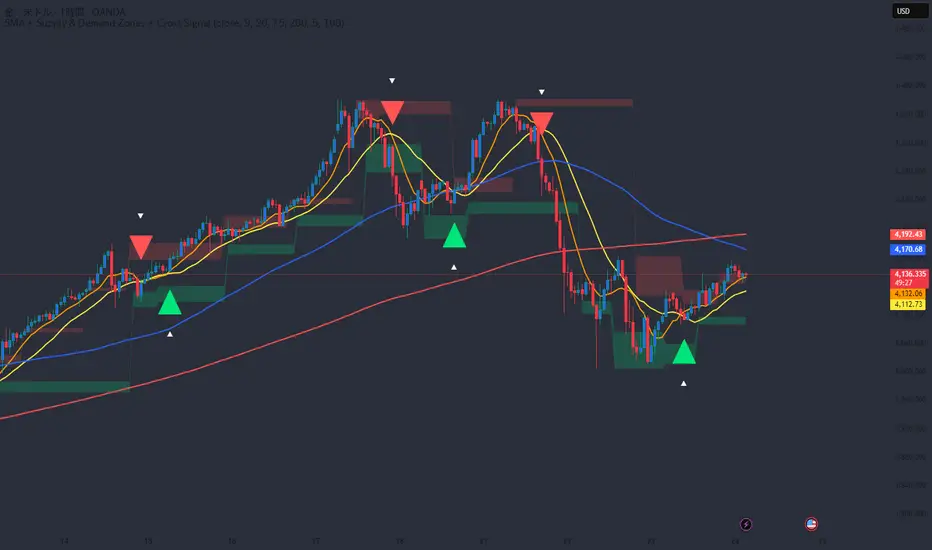
This indicator is designed to help traders visually identify both trend direction and potential reversal zones in one glance.
📊 Key Features:
• Displays 4 SMAs (9 / 20 / 75 / 200) simultaneously
• Automatically detects and plots Demand Zones (green) and Supply Zones (red) based on recent swing highs and lows
• Shows ▲ Golden Cross and ▼ Dead Cross markers when SMA 9 crosses SMA 20
• Built-in alert conditions for SMA crossovers and zone breakouts
💡 How to Use:
Use SMA direction and alignment to confirm the trend, and watch for Supply/Demand zones and cross signals as potential reversal or breakout setups.
Perfect for spotting pullbacks and identifying confluence zones between trend and structure.
⚙️ Customization:
• Adjustable SMA lengths, colors, and line widths
• Modify pivot length to fine-tune zone sensitivity
✅ Built with Pine Script v5
✅ Works on FX, Stocks, Crypto, and Indices
Author’s Note:
I created this indicator to combine trend-following tools with supply-demand logic in a clean and intuitive way.
Even beginners can easily visualize where reactions or breakouts are likely to happen.
If you find this script helpful, please give it a ❤️ and follow for more updates!
開源腳本
In true TradingView spirit, the creator of this script has made it open-source, so that traders can review and verify its functionality. Kudos to the author! While you can use it for free, remember that republishing the code is subject to our House Rules.
免責聲明
The information and publications are not meant to be, and do not constitute, financial, investment, trading, or other types of advice or recommendations supplied or endorsed by TradingView. Read more in the Terms of Use.