OPEN-SOURCE SCRIPT
NSDT Gap Finder
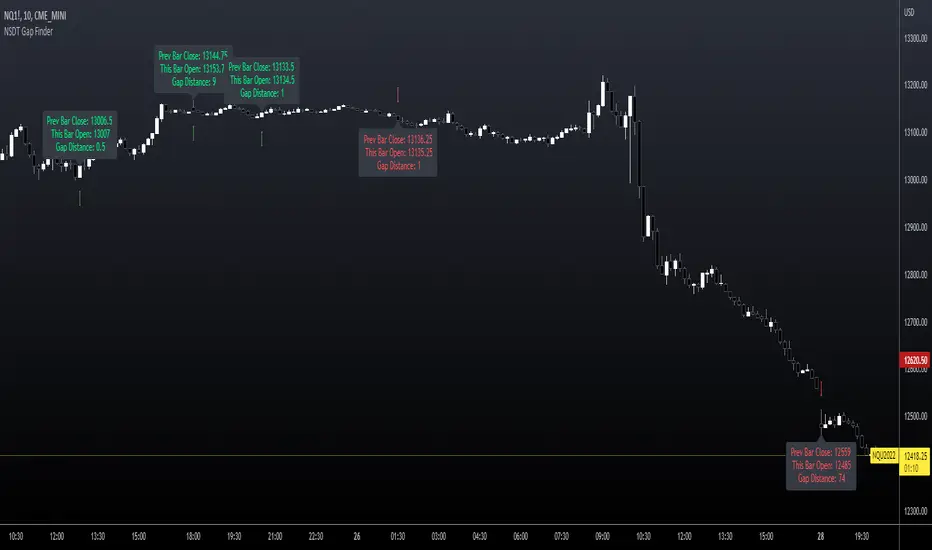
This script plots gaps between candles.
It uses the "round_to_mintick" feature in the Pinescript code, so it works on any instrument out to 3 decimal places.
If there is a Gap Up (open of current candle is greater than the close of previous candle) it will plot a green arrow under the current candle and plot a label above the current candle to show the Gap Amount.
If there is a Gap Down (open of current candle is less than the close of previous candle) it will plot a red arrow over the current candle and plot a label below the current candle to show the Gap Amount.
You can turn the label and/or the arrow on and off.
I created this indicator to more easily identify gaps in the market. The probability of a gap being filled is extremely high. Some are right away (intraday candle to candle), some take a while (gap from previous day close to current day open), and some make take a long time (close at end of previous week to open at beginning of current week).
This is published free to use and open source code.
Please see my other similar Gap Indicators.
Daily Gap Range

USA Session - Previous Day Close Gap to Current Day Open

It uses the "round_to_mintick" feature in the Pinescript code, so it works on any instrument out to 3 decimal places.
If there is a Gap Up (open of current candle is greater than the close of previous candle) it will plot a green arrow under the current candle and plot a label above the current candle to show the Gap Amount.
If there is a Gap Down (open of current candle is less than the close of previous candle) it will plot a red arrow over the current candle and plot a label below the current candle to show the Gap Amount.
You can turn the label and/or the arrow on and off.
I created this indicator to more easily identify gaps in the market. The probability of a gap being filled is extremely high. Some are right away (intraday candle to candle), some take a while (gap from previous day close to current day open), and some make take a long time (close at end of previous week to open at beginning of current week).
This is published free to use and open source code.
Please see my other similar Gap Indicators.
Daily Gap Range
USA Session - Previous Day Close Gap to Current Day Open
開源腳本
本著TradingView的真正精神,此腳本的創建者將其開源,以便交易者可以查看和驗證其功能。向作者致敬!雖然您可以免費使用它,但請記住,重新發佈程式碼必須遵守我們的網站規則。
ALL indicators, strategies and bots are included with Discord access.
NorthStarDayTrading.com/discord
youtube.com/shorts/fWFQE7uEHvU
NorthStarDayTrading.com/discord
youtube.com/shorts/fWFQE7uEHvU
免責聲明
這些資訊和出版物並不意味著也不構成TradingView提供或認可的金融、投資、交易或其他類型的意見或建議。請在使用條款閱讀更多資訊。