OPEN-SOURCE SCRIPT
Currency Strength V2
An update to my original Currency Strength script to include a 2nd timeframe for more market context.
Changed the formatting slightly for better aesthetics, as the extra column and colors became unsightly.
Also added a new setting for "Flat Color", which changes the value background to a simple green/red for above or below 50, rather than using the Color Scale that increases color intensity the further it gets from 50.
________________________________________________________________________________
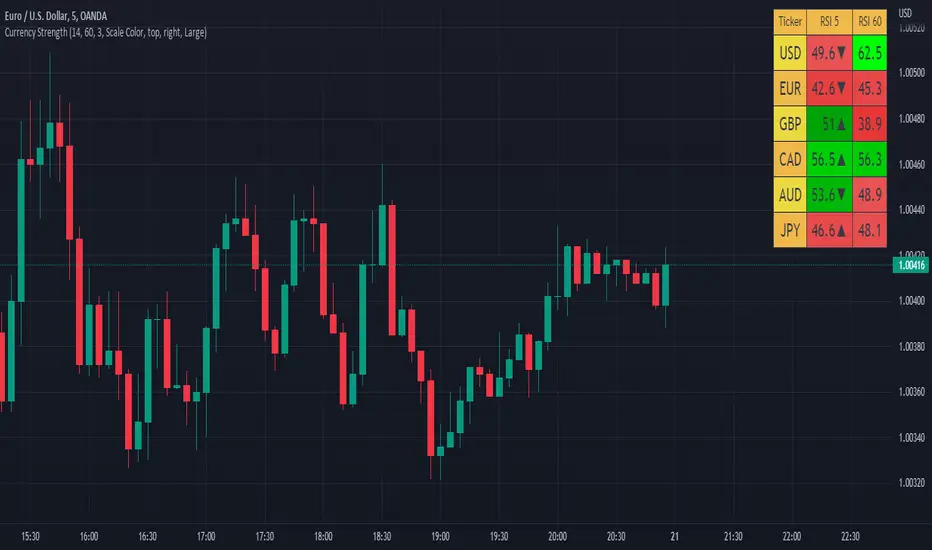
This script measures the strength of the 6 major currencies USD, EUR, GBP, CAD, AUD and JPY.
Simply, it averages the RSI values of a currency vs the 5 other currencies in the basket, and displays each average RSI value in a table with color coding to quickly identify the strongest and weakest currencies over the past 14 bars (or user defined length).
The arrow in the current RSI column shows the difference in average RSI value between current and X bars back (user defined), telling you whether the combined RSI value has gone up or down in the last X bars.
Using the average RSI allows us to get a sense of the currency strength vs an equally weighted basket of the other majors, as opposed to using Indexes which are heavily weighted to 1 or 2 currencies.
The additional security calls for the extra timeframe make this slower to load than the original, but this was a user request so hopefully it will prove worthwhile for some people.
Those who find the loading too slow when switching between charts may be better off still using the original, which is why this is posted as a separate script and not an update to the original.
This is the table with Flat Color option enabled.

Changed the formatting slightly for better aesthetics, as the extra column and colors became unsightly.
Also added a new setting for "Flat Color", which changes the value background to a simple green/red for above or below 50, rather than using the Color Scale that increases color intensity the further it gets from 50.
________________________________________________________________________________
This script measures the strength of the 6 major currencies USD, EUR, GBP, CAD, AUD and JPY.
Simply, it averages the RSI values of a currency vs the 5 other currencies in the basket, and displays each average RSI value in a table with color coding to quickly identify the strongest and weakest currencies over the past 14 bars (or user defined length).
The arrow in the current RSI column shows the difference in average RSI value between current and X bars back (user defined), telling you whether the combined RSI value has gone up or down in the last X bars.
Using the average RSI allows us to get a sense of the currency strength vs an equally weighted basket of the other majors, as opposed to using Indexes which are heavily weighted to 1 or 2 currencies.
The additional security calls for the extra timeframe make this slower to load than the original, but this was a user request so hopefully it will prove worthwhile for some people.
Those who find the loading too slow when switching between charts may be better off still using the original, which is why this is posted as a separate script and not an update to the original.
This is the table with Flat Color option enabled.
開源腳本
秉持TradingView一貫精神,這個腳本的創作者將其設為開源,以便交易者檢視並驗證其功能。向作者致敬!您可以免費使用此腳本,但請注意,重新發佈代碼需遵守我們的社群規範。
免責聲明
這些資訊和出版物並非旨在提供,也不構成TradingView提供或認可的任何形式的財務、投資、交易或其他類型的建議或推薦。請閱讀使用條款以了解更多資訊。
開源腳本
秉持TradingView一貫精神,這個腳本的創作者將其設為開源,以便交易者檢視並驗證其功能。向作者致敬!您可以免費使用此腳本,但請注意,重新發佈代碼需遵守我們的社群規範。
免責聲明
這些資訊和出版物並非旨在提供,也不構成TradingView提供或認可的任何形式的財務、投資、交易或其他類型的建議或推薦。請閱讀使用條款以了解更多資訊。