OPEN-SOURCE SCRIPT
Dynamic SMA
Timeframe Detection: The indicator first identifies the current timeframe of the chart (e.g., daily, 4-hour, 1-hour).
SMA Calculation: It calculates three different SMAs:
Daily SMA: A 8-period SMA calculated on daily closing prices.
4-Hour SMA: A 50-period SMA calculated on 4-hour closing prices.
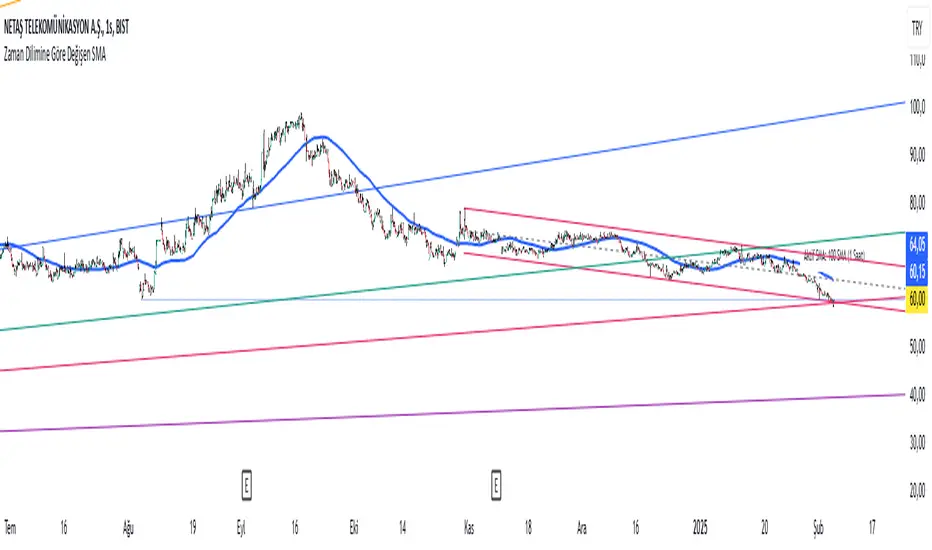
1-Hour SMA: A 100-period SMA calculated on 1-hour closing prices.
Dynamic SMA Selection: Based on the detected timeframe, the indicator selects the appropriate SMA to display:
If the timeframe is daily, it uses the daily SMA.
If the timeframe is 4-hour, it uses the 4-hour SMA.
If the timeframe is 1-hour, it uses the 1-hour SMA.
Plotting: The selected SMA is plotted on the chart as a blue line.
Dynamic Label: The indicator also creates a dynamic label that displays the current SMA being used, along with the corresponding timeframe and period. For example, it will show "Active SMA: 8 SMA (Daily)" when the daily SMA is active.
This indicator is useful for traders who want to use different SMAs for different timeframes without having to manually switch between them. It provides a convenient way to see the relevant SMA for the current chart view.
SMA Calculation: It calculates three different SMAs:
Daily SMA: A 8-period SMA calculated on daily closing prices.
4-Hour SMA: A 50-period SMA calculated on 4-hour closing prices.
1-Hour SMA: A 100-period SMA calculated on 1-hour closing prices.
Dynamic SMA Selection: Based on the detected timeframe, the indicator selects the appropriate SMA to display:
If the timeframe is daily, it uses the daily SMA.
If the timeframe is 4-hour, it uses the 4-hour SMA.
If the timeframe is 1-hour, it uses the 1-hour SMA.
Plotting: The selected SMA is plotted on the chart as a blue line.
Dynamic Label: The indicator also creates a dynamic label that displays the current SMA being used, along with the corresponding timeframe and period. For example, it will show "Active SMA: 8 SMA (Daily)" when the daily SMA is active.
This indicator is useful for traders who want to use different SMAs for different timeframes without having to manually switch between them. It provides a convenient way to see the relevant SMA for the current chart view.
開源腳本
秉持TradingView一貫精神,這個腳本的創作者將其設為開源,以便交易者檢視並驗證其功能。向作者致敬!您可以免費使用此腳本,但請注意,重新發佈代碼需遵守我們的社群規範。
免責聲明
這些資訊和出版物並非旨在提供,也不構成TradingView提供或認可的任何形式的財務、投資、交易或其他類型的建議或推薦。請閱讀使用條款以了解更多資訊。
開源腳本
秉持TradingView一貫精神,這個腳本的創作者將其設為開源,以便交易者檢視並驗證其功能。向作者致敬!您可以免費使用此腳本,但請注意,重新發佈代碼需遵守我們的社群規範。
免責聲明
這些資訊和出版物並非旨在提供,也不構成TradingView提供或認可的任何形式的財務、投資、交易或其他類型的建議或推薦。請閱讀使用條款以了解更多資訊。