OPEN-SOURCE SCRIPT
Consecutive Lower Highs/Higher Lows v1 [tradinggeniusberlin]
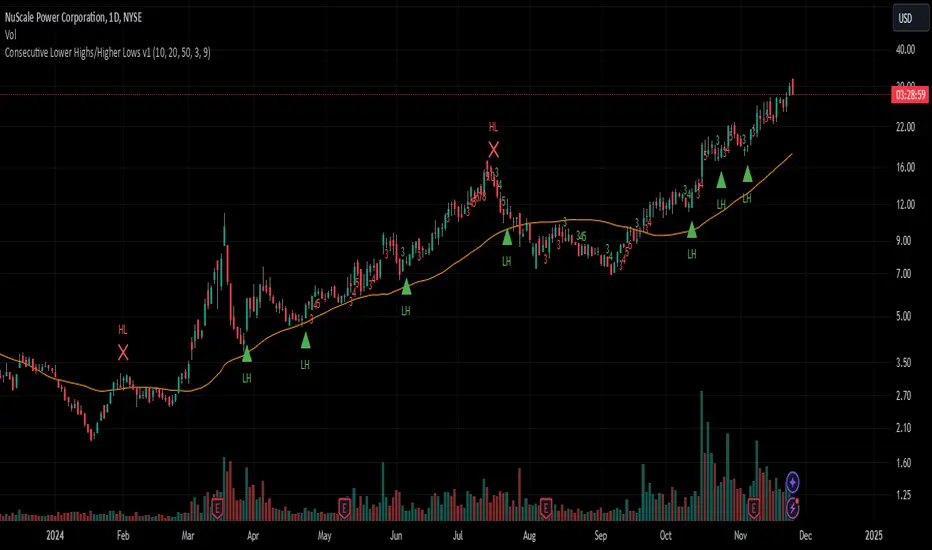
This indicator counts the lower highs and higher low streaks. If the streak is above a certain threshold a buy or exit arrow is shown.
Idea:
The probability of a reversal is rising the more lower highs the asset had already because if mean reversion tendencies of asset prices. Especially in uptrend above the 20ma and/or 50ma.
How to use it:
In Uptrends, lower high streak of 3 or more, enter at first new high.
Idea:
The probability of a reversal is rising the more lower highs the asset had already because if mean reversion tendencies of asset prices. Especially in uptrend above the 20ma and/or 50ma.
How to use it:
In Uptrends, lower high streak of 3 or more, enter at first new high.
開源腳本
秉持TradingView一貫精神,這個腳本的創作者將其設為開源,以便交易者檢視並驗證其功能。向作者致敬!您可以免費使用此腳本,但請注意,重新發佈代碼需遵守我們的社群規範。
免責聲明
這些資訊和出版物並非旨在提供,也不構成TradingView提供或認可的任何形式的財務、投資、交易或其他類型的建議或推薦。請閱讀使用條款以了解更多資訊。
開源腳本
秉持TradingView一貫精神,這個腳本的創作者將其設為開源,以便交易者檢視並驗證其功能。向作者致敬!您可以免費使用此腳本,但請注意,重新發佈代碼需遵守我們的社群規範。
免責聲明
這些資訊和出版物並非旨在提供,也不構成TradingView提供或認可的任何形式的財務、投資、交易或其他類型的建議或推薦。請閱讀使用條款以了解更多資訊。