OPEN-SOURCE SCRIPT
Kalman Supertrend (High vs Low) Bands by Skyito V2
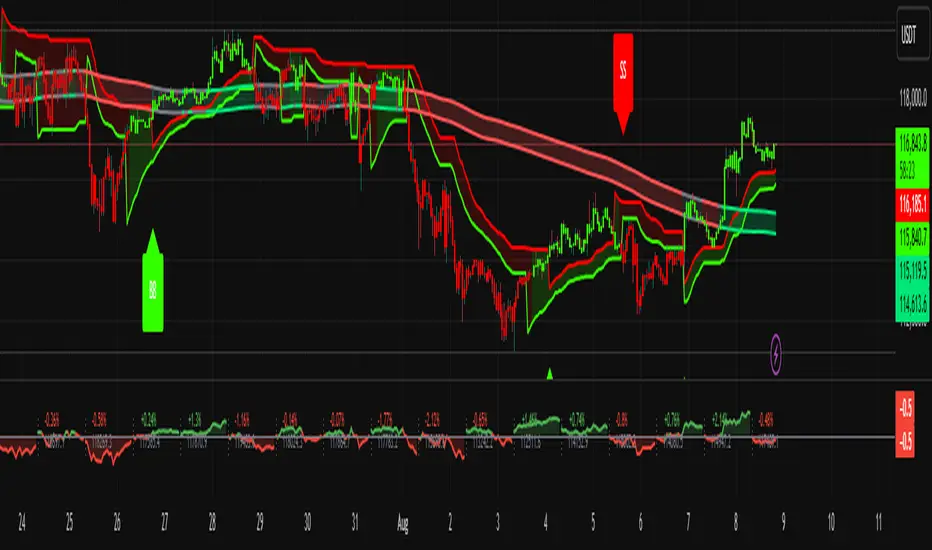
Inspired by BackQuant's Kalman Hull Supertrend, this upgraded version replaces the typical Kalman-close method with Kalman-filtered High and Low sources. This approach provides clearer trend visualization and helps confirm potential breakouts or reversals using clean, directional candle signals.
The core logic revolves around BB (Band Buy) and SS (Band Sell) signals:
BB appears only when a candle fully breaks above both Kalman High and Low bands.
SS appears when a candle fully breaks below both bands.
These clean triggers help avoid false signals and are excellent for capturing high-probability trend shifts.
✅ The Supertrend line is also included and can be toggled on or off — useful for those who prefer early trend detection or confirmation.
🆕 Why the SMA Band was Included
To complement the Kalman band system, a Moving Average Band (default: SMA 200) is added:
It helps detect the long-term trend direction.
Candles are colored green when above the SMA band and red when below.
This visual cue strengthens trend confidence and adds an extra layer for filtering trades.
The MA band and coloring can be turned on or off based on preference.
This tool is built for traders who want a clean trend-following and breakout confirmation system. It can be used as a standalone strategy or paired with price action, volume, or support/resistance tools.
開源腳本
秉持TradingView一貫精神,這個腳本的創作者將其設為開源,以便交易者檢視並驗證其功能。向作者致敬!您可以免費使用此腳本,但請注意,重新發佈代碼需遵守我們的社群規範。
免責聲明
這些資訊和出版物並非旨在提供,也不構成TradingView提供或認可的任何形式的財務、投資、交易或其他類型的建議或推薦。請閱讀使用條款以了解更多資訊。
免責聲明
這些資訊和出版物並非旨在提供,也不構成TradingView提供或認可的任何形式的財務、投資、交易或其他類型的建議或推薦。請閱讀使用條款以了解更多資訊。