PROTECTED SOURCE SCRIPT
已更新 Previous Day & Premarket High/Low
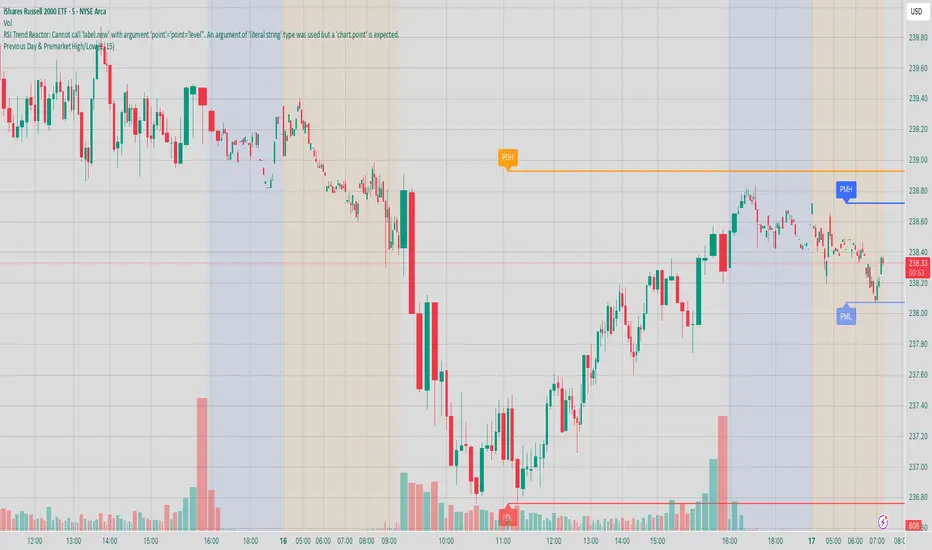
# Previous Day & Premarket High/Low Indicator
## Overview
This TradingView Pine Script indicator displays previous day's high/low levels and premarket high/low levels (HOD/LOD) directly on your chart. It helps traders identify key support and resistance levels from the previous trading day and track premarket price action.
## Features
### 📊 Previous Day Levels
- **Previous Day High (PDH)**: Shows the highest price from the previous trading day
- **Previous Day Low (PDL)**: Shows the lowest price from the previous trading day
- **Dynamic lines**: Automatically update each day with new previous day levels
- **Customizable colors**: Green for high, red for low (configurable)
### 🌅 Premarket Levels
- **Live Premarket HOD/LOD**: Real-time tracking of premarket high and low during premarket hours (4:00 AM - 9:30 AM)
- **Static Premarket Levels**: Frozen levels captured at 9:29 AM that persist throughout the trading day
- **Automatic session detection**: Identifies premarket vs regular trading hours
- **Time-based extension**: Lines extend to 4:00 PM end of trading day
## Time Sessions
### Premarket Session
- **Time**: 4:00 AM - 9:30 AM ET
- **Live tracking**: HOD/LOD update in real-time during premarket
- **Capture time**: Final values captured at 9:29 AM for static display
### Regular Trading Session
- **Time**: 9:30 AM - 4:00 PM ET
- **Static display**: Shows frozen premarket levels from 9:29 AM
- **Previous day levels**: Displays levels from the prior trading day
## Visual Elements
### Line Types
1. **Previous Day High**: Solid green line (customizable color)
2. **Previous Day Low**: Solid red line (customizable color)
3. **Live Premarket HOD**: Solid blue line (updates during premarket only)
4. **Live Premarket LOD**: Solid orange line (updates during premarket only)
5. **Static Premarket HOD**: Dashed blue line (frozen at 9:29 AM)
6. **Static Premarket LOD**: Dashed orange line (frozen at 9:29 AM)
### Labels
- **PDH/PDL**: Previous day high/low labels on the right side
- **PreMarket HOD/LOD**: Live premarket labels (during premarket hours)
- **Static Pre HOD/LOD**: Static premarket labels (after 9:29 AM)
## Input Settings
### Display Options
- **Show Previous Day High/Low**: Toggle previous day levels on/off
- **Show Premarket High/Low**: Toggle premarket levels on/off
- **Line Width**: Adjust thickness of all lines (1-5)
### Color Customization
- **Previous Day High Color**: Default green
- **Previous Day Low Color**: Default red
- **Premarket High Color**: Default blue
- **Premarket Low Color**: Default orange
發行說明
a發行說明
Added alert options發行說明
Fix Previous day HL value.發行說明
Added opening range option and lines發行說明
Fixed lines labels發行說明
Update color發行說明
Fixed lines showing wrong PDH PDL at premarket受保護腳本
此腳本以閉源形式發佈。 不過,您可以自由使用,沒有任何限制 — 點擊此處了解更多。
免責聲明
這些資訊和出版物並非旨在提供,也不構成TradingView提供或認可的任何形式的財務、投資、交易或其他類型的建議或推薦。請閱讀使用條款以了解更多資訊。
免責聲明
這些資訊和出版物並非旨在提供,也不構成TradingView提供或認可的任何形式的財務、投資、交易或其他類型的建議或推薦。請閱讀使用條款以了解更多資訊。