INVITE-ONLY SCRIPT
Contraction & Expansion Multi-Screener
█ Overview:
The Contraction & Expansion Multi-Screener analyzes market volatility across many symbols. It provides insights into whether a market is contracting or expanding in volatility. With using a range of statistical models for modeling realized volatility, the script calculates, ranks, and monitors the degree of contraction or expansions in market volatility. The objective is to provide actionable insights into the current market phases by using historical data to model current volatility conditions.
This indicator accomplishes this by aggregating a variety of volatility measures, computing ranks, and applying threshold-based methods to identify transitions in market behavior. Volatility itself helps you understand if the market is moving a lot. High volatility or volatility that is increasing over time, means that the price is moving a lot. Volatility also mean reverts so if its extremely low, you can eventually expect it to return to its expected value, meaning there will be bigger price moves, and vice versa.

█ Features of the Indicator
This indicator allows the user to select up to 14 different symbols and retrieve their price data. There is five different types of volatility models that you can choose from in the settings of this indicator for how to use the screener.
Volatility Settings:
Standard Deviation, Mean Absolute Deviation, and EWMA use returns to model the volatility, meanwhile Relative Standard Deviation uses price instead due to its geometric properties, and Average True Range for capturing the absolute movement in price. In this indicator the volatility is ranked, so if the volatility is at 0 or near 0 then it is contracting and the volatility is low. If the volatility is near 100 or at 100 then the volatility is at its maximum.
For traders that use the Forex Master Pattern Indicator 2 and want to use this indicator for that indicator, it is recommended to set your volatility type to Relative Standard Deviation.
Users can also modify the location of the screener to be on the top left, top right, bottom left, or bottom right. You also can disable sections of the screener and show a smaller list if you want to.

The Contraction & Expansion Screener shows you the following information:
The Contraction & Expansion Multi-Screener analyzes market volatility across many symbols. It provides insights into whether a market is contracting or expanding in volatility. With using a range of statistical models for modeling realized volatility, the script calculates, ranks, and monitors the degree of contraction or expansions in market volatility. The objective is to provide actionable insights into the current market phases by using historical data to model current volatility conditions.
This indicator accomplishes this by aggregating a variety of volatility measures, computing ranks, and applying threshold-based methods to identify transitions in market behavior. Volatility itself helps you understand if the market is moving a lot. High volatility or volatility that is increasing over time, means that the price is moving a lot. Volatility also mean reverts so if its extremely low, you can eventually expect it to return to its expected value, meaning there will be bigger price moves, and vice versa.
█ Features of the Indicator
This indicator allows the user to select up to 14 different symbols and retrieve their price data. There is five different types of volatility models that you can choose from in the settings of this indicator for how to use the screener.
Volatility Settings:
- Standard Deviation
- Relative Standard Deviation
- Mean Absolute Deviation
- Exponentially Weighted Moving Average (EWMA)
- Average True Range (ATR)
Standard Deviation, Mean Absolute Deviation, and EWMA use returns to model the volatility, meanwhile Relative Standard Deviation uses price instead due to its geometric properties, and Average True Range for capturing the absolute movement in price. In this indicator the volatility is ranked, so if the volatility is at 0 or near 0 then it is contracting and the volatility is low. If the volatility is near 100 or at 100 then the volatility is at its maximum.
For traders that use the Forex Master Pattern Indicator 2 and want to use this indicator for that indicator, it is recommended to set your volatility type to Relative Standard Deviation.
Users can also modify the location of the screener to be on the top left, top right, bottom left, or bottom right. You also can disable sections of the screener and show a smaller list if you want to.
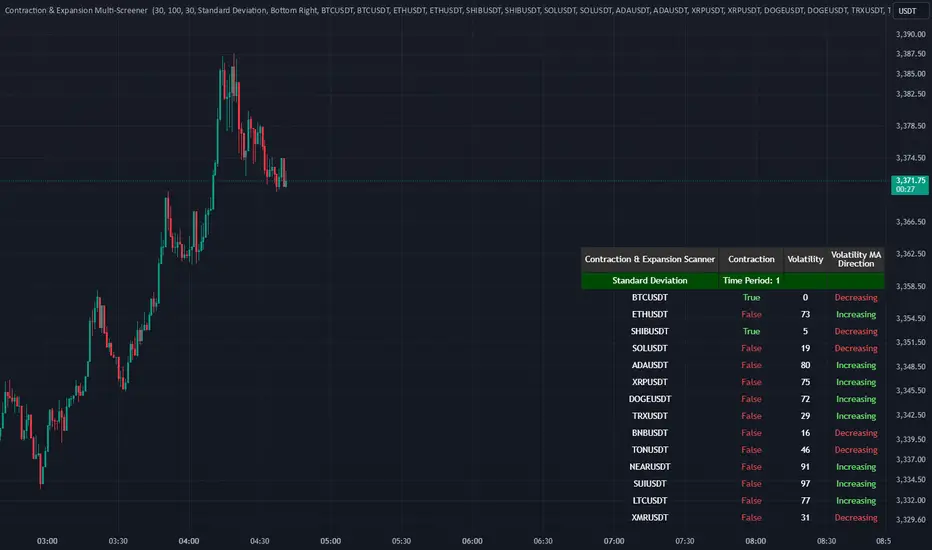
The Contraction & Expansion Screener shows you the following information:
- Confirmation of whether or not there is a contraction or expansion
- Percentage Rank of the volatility
- Volatility MA direction: This screener uses moving averages on the volatility to determine if its increasing over time or decreasing over time.
僅限邀請腳本
僅作者批准的使用者才能訪問此腳本。您需要申請並獲得使用許可,通常需在付款後才能取得。更多詳情,請依照作者以下的指示操作,或直接聯絡Traders_Endeavors。
TradingView不建議在未完全信任作者並了解其運作方式的情況下購買或使用腳本。您也可以在我們的社群腳本中找到免費的開源替代方案。
作者的說明
Access this indicator here: https://www.patreon.com/user?u=80987417
Link Tree: linktr.ee/tradersendeavors
Access our indicators: patreon.com/user?u=80987417
Access our indicators: patreon.com/user?u=80987417
免責聲明
這些資訊和出版物並非旨在提供,也不構成TradingView提供或認可的任何形式的財務、投資、交易或其他類型的建議或推薦。請閱讀使用條款以了解更多資訊。