OPEN-SOURCE SCRIPT
已更新 Volatility Meter
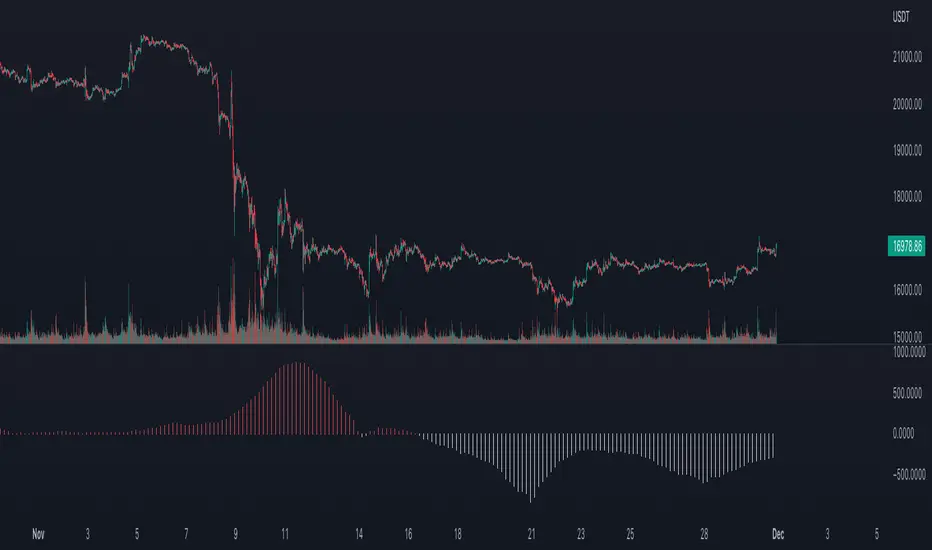
The title is quite self explanatory. It is a Volatility Meter based on Bollinger Bands Width and MA.
These parameters can be selected by users in settings tab:
- Basic Bollinger Bands Parameters: length, standart deviation and source
- Timeframes: 1h, 2h, 3h and 4h
If the indicator is red it means volatility is high in the market. If it is white, it means that market is not volatile right now.
These parameters can be selected by users in settings tab:
- Basic Bollinger Bands Parameters: length, standart deviation and source
- Timeframes: 1h, 2h, 3h and 4h
If the indicator is red it means volatility is high in the market. If it is white, it means that market is not volatile right now.
發行說明
The title is self-explanatory. It is a Volatility Meter based on Bollinger Bands Width and Moving Averages. It also uses the concept of multi-time frame analysis.You can decide the options below on the settings tab:
- Basic Bollinger Bands Parameters: length, standart deviation and source
- Timeframes: 1h, 2h, 3h and 4h
If the indicator is red, it means volatility is high in the market. If it is white, it means the market is not volatile right now. If you use it in a smaller timeframe than it is calculated then you will get the multi-timeframe analysis of the volatility. As could be seen on the chart above, if it is red it usually means that big market moves are expected.
Use it on 4H or smaller time frames to get the multi-time frame volatility insight. If you use it on the time frame greater than 4H please select the calculated time frame accordingly. (NOTE: credits on the source code is removed.)
開源腳本
秉持TradingView一貫精神,這個腳本的創作者將其設為開源,以便交易者檢視並驗證其功能。向作者致敬!您可以免費使用此腳本,但請注意,重新發佈代碼需遵守我們的社群規範。
免責聲明
這些資訊和出版物並非旨在提供,也不構成TradingView提供或認可的任何形式的財務、投資、交易或其他類型的建議或推薦。請閱讀使用條款以了解更多資訊。
免責聲明
這些資訊和出版物並非旨在提供,也不構成TradingView提供或認可的任何形式的財務、投資、交易或其他類型的建議或推薦。請閱讀使用條款以了解更多資訊。