OPEN-SOURCE SCRIPT
已更新 Glowing RSI Candlesticks (With Buy and Sell helpers)
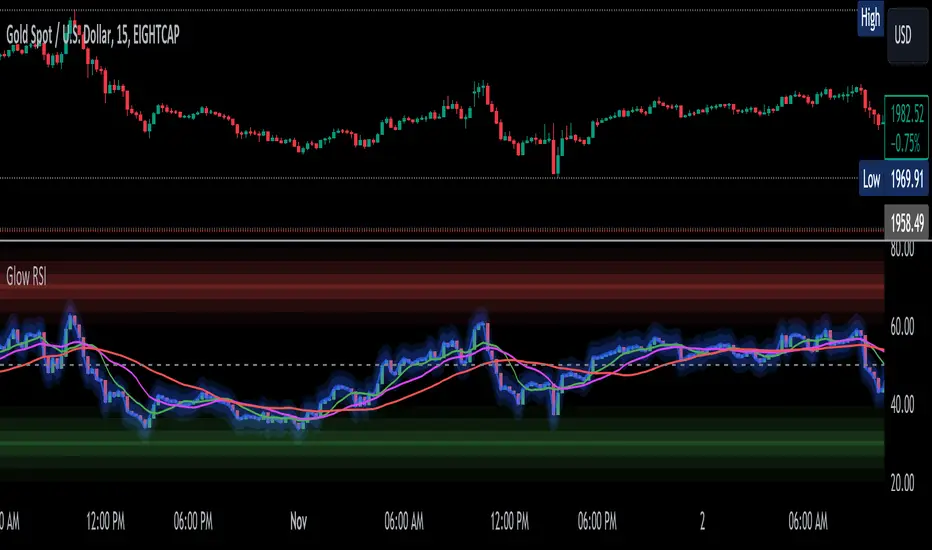
This is not your average, boring RSI indicator.
This indicator is still an RSI (momentum) indicator, but I have converted the line into candlesticks.
It has an option to make it glow neon blue to make it look cooler (dark background recommended for full effect).
There is a red zone at 70, because of course, and a green zone at 30 for the same reason.
On top of that, it has triple moving averages, two of which it uses to create some simple buy and sell indications (the vertical green and red lines).
Enjoy! :)
發行說明
- I got rid of the vertical lines (buy and sell helpers) since they were really just based on a strategy that cluttered the indicator more than provide anything of any value, at least in most cases. 開源腳本
秉持TradingView一貫精神,這個腳本的創作者將其設為開源,以便交易者檢視並驗證其功能。向作者致敬!您可以免費使用此腳本,但請注意,重新發佈代碼需遵守我們的社群規範。
免責聲明
這些資訊和出版物並非旨在提供,也不構成TradingView提供或認可的任何形式的財務、投資、交易或其他類型的建議或推薦。請閱讀使用條款以了解更多資訊。
開源腳本
秉持TradingView一貫精神,這個腳本的創作者將其設為開源,以便交易者檢視並驗證其功能。向作者致敬!您可以免費使用此腳本,但請注意,重新發佈代碼需遵守我們的社群規範。
免責聲明
這些資訊和出版物並非旨在提供,也不構成TradingView提供或認可的任何形式的財務、投資、交易或其他類型的建議或推薦。請閱讀使用條款以了解更多資訊。