OPEN-SOURCE SCRIPT
Simple Risk-to-Reward (R) Indicator (TP1–TP2)

What this indicator does:
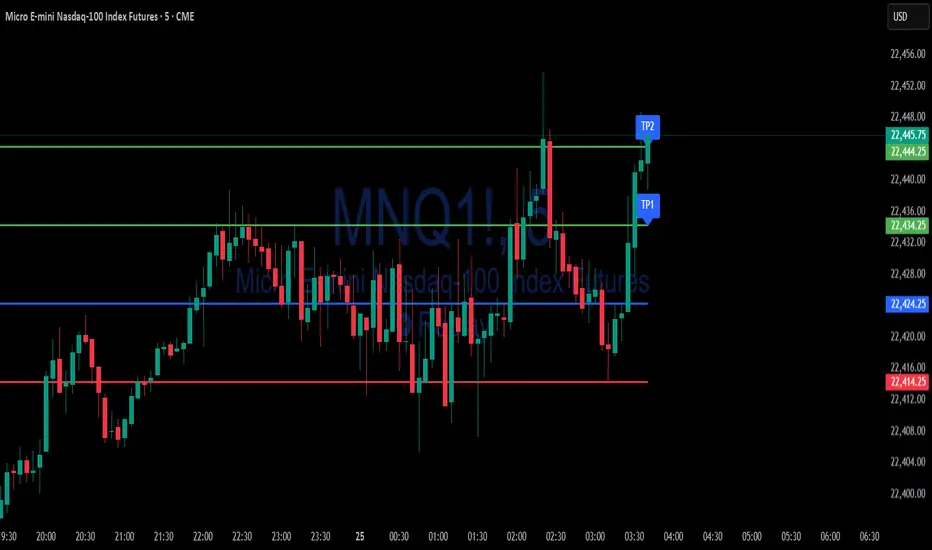
This tool helps traders clearly visualize their risk and reward on any trade by plotting their entry, stop loss, and take-profit (TP) levels directly on the chart. It’s designed to make manual trade planning more visual and systematic.
How it works:
How to use it:
What makes it unique and useful:
This indicator is designed for manual trade planning, giving you full control over your inputs and letting you instantly see your risk/reward on any instrument or timeframe. Unlike some built-in tools, it supports both long and short trades, lets you set all levels manually, and keeps your charts clean and easy to interpret.
This tool helps traders clearly visualize their risk and reward on any trade by plotting their entry, stop loss, and take-profit (TP) levels directly on the chart. It’s designed to make manual trade planning more visual and systematic.
How it works:
- You set your planned entry price, whether you want to plot a Long or Short setup, and your stop-loss distance (in ticks).
- The indicator calculates your stop-loss level and automatically plots it on the chart.
- It then draws take-profit levels at 1R and 2R (where “R” is your risk, the distance between entry and stop).
- You can toggle the TP1 and TP2 lines on or off to suit your preference.
How to use it:
- Open the settings and enter your intended entry price.
- Select “Long Setup” for a buy trade, or turn it off for a sell/short trade.
- Enter your desired stop loss in ticks.
- Choose which take-profit levels to display by toggling TP1 and TP2.
- The indicator will show entry, stop, and take-profit levels right on your chart so you can easily see your planned risk/reward.
What makes it unique and useful:
This indicator is designed for manual trade planning, giving you full control over your inputs and letting you instantly see your risk/reward on any instrument or timeframe. Unlike some built-in tools, it supports both long and short trades, lets you set all levels manually, and keeps your charts clean and easy to interpret.
開源腳本
秉持TradingView一貫精神,這個腳本的創作者將其設為開源,以便交易者檢視並驗證其功能。向作者致敬!您可以免費使用此腳本,但請注意,重新發佈代碼需遵守我們的社群規範。
Simple Indicators – Premium tools & more: simpleindicators.gumroad.com/
免責聲明
這些資訊和出版物並非旨在提供,也不構成TradingView提供或認可的任何形式的財務、投資、交易或其他類型的建議或推薦。請閱讀使用條款以了解更多資訊。
開源腳本
秉持TradingView一貫精神,這個腳本的創作者將其設為開源,以便交易者檢視並驗證其功能。向作者致敬!您可以免費使用此腳本,但請注意,重新發佈代碼需遵守我們的社群規範。
Simple Indicators – Premium tools & more: simpleindicators.gumroad.com/
免責聲明
這些資訊和出版物並非旨在提供,也不構成TradingView提供或認可的任何形式的財務、投資、交易或其他類型的建議或推薦。請閱讀使用條款以了解更多資訊。