OPEN-SOURCE SCRIPT
Volatility Price Range
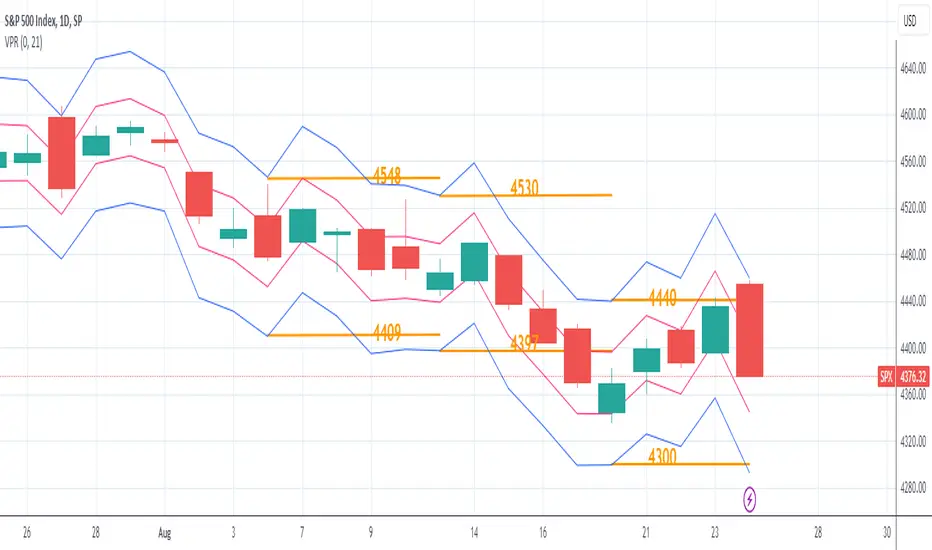
The Volatility Price Range is an overlay which estimates a price range for the next seven days and next day, based on historical volatility (already available in TradingView). The upper and lower bands are calculated as follows:
The Volatility for one week is calculated using the formula: WV = HV * √t where:
WV: one-week volatility
HV: annual volatility
√: square root
t: the time factor expressed in years
From this formula we can deduce the weekly volatility WV = HV * √(1 / 52) = HV / 7.2 where 52: weeks in a year.
The daily volatility DV = HV * √(1 / 365) = HV / 19.1 where 365: days in a year.
To calculate the lower and upper value of the bands, the weekly/daily volatility value obtained will be subtracted/added from/to the current price.
開源腳本
秉持TradingView一貫精神,這個腳本的創作者將其設為開源,以便交易者檢視並驗證其功能。向作者致敬!您可以免費使用此腳本,但請注意,重新發佈代碼需遵守我們的社群規範。
免責聲明
這些資訊和出版物並非旨在提供,也不構成TradingView提供或認可的任何形式的財務、投資、交易或其他類型的建議或推薦。請閱讀使用條款以了解更多資訊。
開源腳本
秉持TradingView一貫精神,這個腳本的創作者將其設為開源,以便交易者檢視並驗證其功能。向作者致敬!您可以免費使用此腳本,但請注意,重新發佈代碼需遵守我們的社群規範。
免責聲明
這些資訊和出版物並非旨在提供,也不構成TradingView提供或認可的任何形式的財務、投資、交易或其他類型的建議或推薦。請閱讀使用條款以了解更多資訊。