OPEN-SOURCE SCRIPT
已更新 EMA_cumulativeVolume_crossover [indicator]
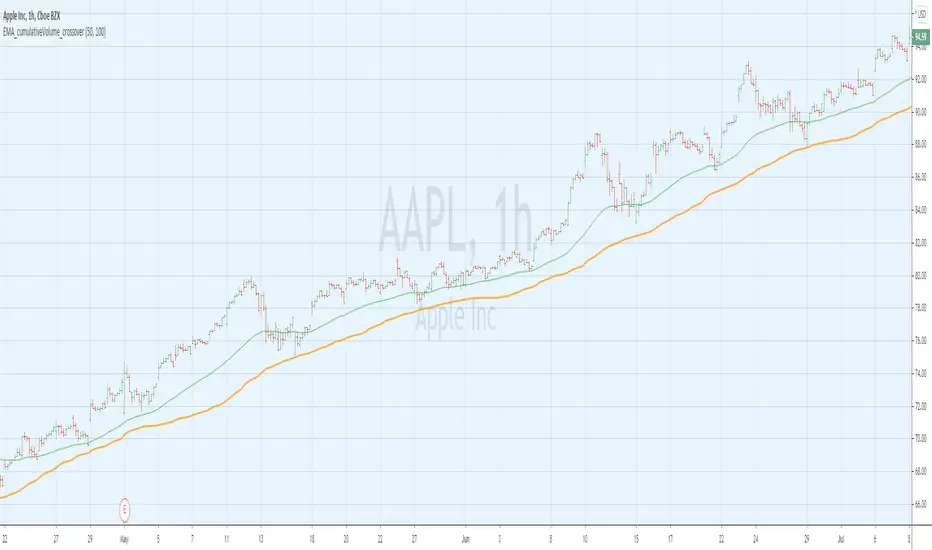
while I was doing some research with exp MA crossovers and volume indicator , I have noticed that when ema 50 is above cumulative volume of 100 period , shows to capture nice profits in that trend. Shorting also (ema50 cross down volume of 100 period) also shows nice results.
BUY
When ema50 crossover cumulative volume of 100 period
Exit
When ema50 cross down cumulative volume of 100 period
Short Selling
Reverse above BUY conditions
Back ground color shows blue when ema50 is above cumulative volume of 100 period, shows purple when ema50 is below cumulative volume of 100 period
I will publish the strategy for back testing later today
Warning
For the use of educational purpose only
發行說明
variable name corrected ... 開源腳本
秉持TradingView一貫精神,這個腳本的創作者將其設為開源,以便交易者檢視並驗證其功能。向作者致敬!您可以免費使用此腳本,但請注意,重新發佈代碼需遵守我們的社群規範。
免責聲明
這些資訊和出版物並非旨在提供,也不構成TradingView提供或認可的任何形式的財務、投資、交易或其他類型的建議或推薦。請閱讀使用條款以了解更多資訊。
免責聲明
這些資訊和出版物並非旨在提供,也不構成TradingView提供或認可的任何形式的財務、投資、交易或其他類型的建議或推薦。請閱讀使用條款以了解更多資訊。