OPEN-SOURCE SCRIPT
Oracle Pivot Engine (OPE) — @darshakssc
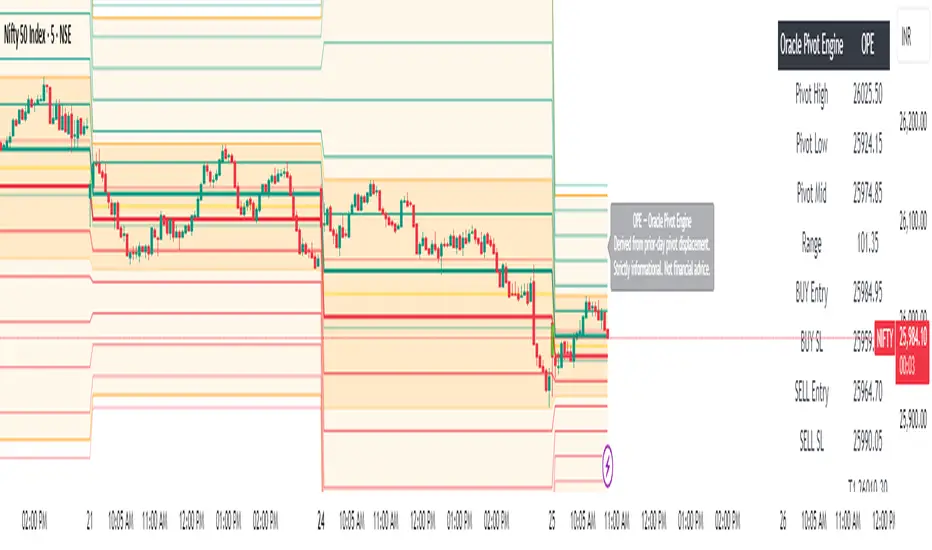
The Oracle Pivot Engine (OPE) is a market-structure visualization tool that derives all its levels exclusively from historical price data — specifically, the previous day’s high, low, and mid-range.
It does not provide signals, alerts, entries, exits, predictions, or trade recommendations.
Instead, it creates a non-repainting reference framework that helps users observe how the current session interacts with the prior session’s completed price structure.
All calculations are analytical, static, and based on fully closed candles.
🧠 How It Works (Core Logic Explained)
OPE computes the following values from the completed prior daily candle:
This displacement range is used to generate symmetrical upward and downward reference zones.
These levels do not update during the session.
They refresh only once per day when a new daily candle closes.
This ensures the indicator remains fully non-repainting and stable on every intraday chart.
📐 Reference Levels Generated
Using the fixed prior-day displacement range, OPE plots:
1. BUY-Side Reference Map (Upward Bias)
These are not trade signals — they are mathematical extensions above the prior-day midpoint for structural interpretation only.
2. SELL-Side Reference Map (Downward Bias)
Again, these levels are not directives.
They are mirrored displacement extensions below the prior-day midpoint.
📊 Pivot Zone & Bands
The indicator includes optional visual layers derived from the same prior-day pivots:
These are purely visual boundaries meant to improve market context.
🧾 Dashboard / HUD Explanation
A compact on-chart HUD summarizes all values.
It displays:
Section | Information (All Historical)
Prior-Day Pivots | High, Low, Mid, Range
BUY Map | Entry, Stop, T1–T6
SELL Map | Entry, Stop, T1–T6
The HUD allows you to quickly review:
Everything shown is static, non-repainting, and for reference only.
📊 How to Analyze It
✔ 1. Contextual Awareness
OPE helps users visually compare current intraday price to prior daily structure.
You can observe whether price is:
This offers a clearer understanding of daily context and volatility.
✔ 2. Structural Symmetry
The BUY-side and SELL-side maps extend from the same pivot logic.
This can help visualize:
Again — these are observational insights, not signals.
✔ 3. Range Interaction
As the session unfolds, users often study:
This type of analysis is contextual, not predictive.
⚠️ Important Disclosures
🛑 Disclaimer
This indicator is provided solely for educational and informational purposes.
It should not be interpreted as financial advice or a call to action of any kind.
Users should apply independent judgment and discretion when analyzing markets.
It does not provide signals, alerts, entries, exits, predictions, or trade recommendations.
Instead, it creates a non-repainting reference framework that helps users observe how the current session interacts with the prior session’s completed price structure.
All calculations are analytical, static, and based on fully closed candles.
🧠 How It Works (Core Logic Explained)
OPE computes the following values from the completed prior daily candle:
- Prior-Day High
- Prior-Day Low
- Prior-Day Midpoint
- Displacement Range = High − Low
This displacement range is used to generate symmetrical upward and downward reference zones.
These levels do not update during the session.
They refresh only once per day when a new daily candle closes.
This ensures the indicator remains fully non-repainting and stable on every intraday chart.
📐 Reference Levels Generated
Using the fixed prior-day displacement range, OPE plots:
1. BUY-Side Reference Map (Upward Bias)
- BUY Reference Entry
- BUY Reference Stop
- BUY T1
- BUY T2
- BUY T3
- BUY T4
- BUY T5
- BUY T6
These are not trade signals — they are mathematical extensions above the prior-day midpoint for structural interpretation only.
2. SELL-Side Reference Map (Downward Bias)
- SELL Reference Entry
- SELL Reference Stop
- SELL T1
- SELL T2
- SELL T3
- SELL T4
- SELL T5
- SELL T6
Again, these levels are not directives.
They are mirrored displacement extensions below the prior-day midpoint.
📊 Pivot Zone & Bands
The indicator includes optional visual layers derived from the same prior-day pivots:
- Pivot High–Low Zone Shading → shows the prior-day full range
- Pivot Midline → prior-day mid-price
- Outer Displacement Bands → extended contextual boundaries
These are purely visual boundaries meant to improve market context.
🧾 Dashboard / HUD Explanation
A compact on-chart HUD summarizes all values.
It displays:
Section | Information (All Historical)
Prior-Day Pivots | High, Low, Mid, Range
BUY Map | Entry, Stop, T1–T6
SELL Map | Entry, Stop, T1–T6
The HUD allows you to quickly review:
- Where the current price is relative to the previous day’s structure
- How far price is from each level
- Whether the session is operating inside or outside the prior-day displacement zones
Everything shown is static, non-repainting, and for reference only.
📊 How to Analyze It
✔ 1. Contextual Awareness
OPE helps users visually compare current intraday price to prior daily structure.
You can observe whether price is:
- Inside yesterday’s high/low zone
- Above the prior-day displacement
- Below the prior-day displacement
This offers a clearer understanding of daily context and volatility.
✔ 2. Structural Symmetry
The BUY-side and SELL-side maps extend from the same pivot logic.
This can help visualize:
- Expansion away from the prior-day midpoint
- Compression within the prior-day range
- Symmetrical displacement around key reference levels
Again — these are observational insights, not signals.
✔ 3. Range Interaction
As the session unfolds, users often study:
- How price reacts around prior-day midpoint
- Whether price is gravitating toward or away from the displacement levels
- How intraday swings behave within these historical boundaries
This type of analysis is contextual, not predictive.
⚠️ Important Disclosures
- This script does NOT generate trading signals.
- It does NOT predict future price movement.
- It does NOT contain advice, instructions, recommendations, or strategies.
- All levels are derived exclusively from historical daily candle data.
- This is strictly an informational visualization tool meant to support chart analysis.
- Past price levels do not guarantee any future price behavior.
🛑 Disclaimer
This indicator is provided solely for educational and informational purposes.
It should not be interpreted as financial advice or a call to action of any kind.
Users should apply independent judgment and discretion when analyzing markets.
開源腳本
秉持TradingView一貫精神,這個腳本的創作者將其設為開源,以便交易者檢視並驗證其功能。向作者致敬!您可以免費使用此腳本,但請注意,重新發佈代碼需遵守我們的社群規範。
免責聲明
這些資訊和出版物並非旨在提供,也不構成TradingView提供或認可的任何形式的財務、投資、交易或其他類型的建議或推薦。請閱讀使用條款以了解更多資訊。
開源腳本
秉持TradingView一貫精神,這個腳本的創作者將其設為開源,以便交易者檢視並驗證其功能。向作者致敬!您可以免費使用此腳本,但請注意,重新發佈代碼需遵守我們的社群規範。
免責聲明
這些資訊和出版物並非旨在提供,也不構成TradingView提供或認可的任何形式的財務、投資、交易或其他類型的建議或推薦。請閱讀使用條款以了解更多資訊。