INVITE-ONLY SCRIPT
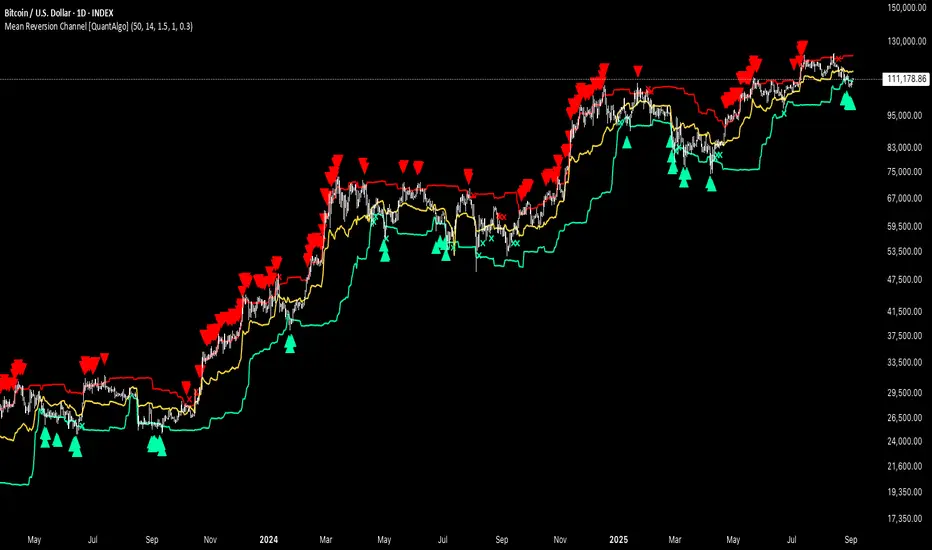
Mean Reversion Channel [QuantAlgo]
🟢 Overview
The Mean Reversion Channel indicator is a range-bound trading system that combines dynamic price channels with momentum-weighted analysis to identify optimal mean reversion opportunities. It creates adaptive upper and lower reversion zones based on recent price action and volatility, while incorporating a momentum-biased equilibrium line that shifts based on volume-weighted price momentum. This creates a three-tier system where traders and investors can identify overbought and oversold conditions within established ranges, detect momentum exhaustion points, and anticipate channel breakouts or breakdowns. This indicator is particularly valuable for strategic dollar cost averaging (DCA) strategies, as it helps identify optimal accumulation zones during oversold conditions and provides tactical risk management levels for systematic investment approaches across different market conditions and asset classes.

🟢 How It Works
The indicator employs a four-stage calculation process that transforms raw price and volume data into actionable mean reversion signals. First, it establishes the base channel by calculating the highest high and lowest low over a user-defined lookback period, creating the foundational price range for mean reversion analysis. This channel adapts continuously as new price data becomes available, ensuring the system remains relevant to current market conditions.
In the second stage, the system calculates volume-weighted momentum by combining price momentum with volume activity. The momentum calculation takes the price change over a specified period and multiplies it by the volume ratio (current volume versus 20-period average volume, for instance) and a volume factor multiplier. This creates momentum readings that are more significant during high-volume periods and less influential during low-volume conditions.
The third stage creates the dynamic reversion zones using Average True Range (ATR) calculations. The upper reversion zone is positioned below the channel high by an ATR-based distance, while the lower reversion zone is positioned above the channel low. These zones contract when momentum is negative (upper zone) or positive (lower zone), creating asymmetric reversion bands that adapt to momentum conditions.
The final stage establishes the momentum-biased equilibrium line by calculating the midpoint between the reversion zones and adjusting it based on momentum bias. When momentum is positive, the equilibrium shifts upward; when negative, it shifts downward. This creates a dynamic reference level that helps identify when price action is moving against the prevailing momentum trend, signaling potential mean reversion opportunities.

🟢 How to Use
1. Mean Reversion Signal Identification

2. Equilibrium Line Analysis and Momentum Exhaustion
3. Channel Expansion and Breakout Detection

🟢 Pro Tips for Trading and Investing
→ Strategic DCA Optimization: Use the lower reversion zone as primary accumulation levels for dollar cost averaging strategies. When price reaches oversold conditions with bearish momentum exhaustion signals, it often represents optimal entry points for systematic investment programs, allowing investors to accumulate positions at statistically favorable price levels within the established range.
→ DCA Pause and Acceleration Signals: Monitor equilibrium line breaks to adjust DCA frequency and amounts. When price consistently trades below equilibrium with momentum exhaustion signals, consider accelerating DCA intervals or increasing investment amounts. Conversely, when price reaches upper reversion zones, consider pausing or reducing DCA activity until more favorable conditions return.
→ Momentum Divergence Detection: Watch for divergences between price action and momentum readings within the channel. When price makes new lows but momentum shows improvement, or price makes new highs with deteriorating momentum, these signal high-probability mean reversion setups ideal for contrarian investment approaches.
→ Alert-Based Systematic Investing/Trading: Utilize the comprehensive alert system for automated DCA triggers. Set up alerts for lower reversion zone touches combined with momentum exhaustion signals to create systematic entry points that remove emotional decision-making from long-term investment strategies, particularly effective for volatile assets where timing improvements can significantly impact overall returns.
The Mean Reversion Channel indicator is a range-bound trading system that combines dynamic price channels with momentum-weighted analysis to identify optimal mean reversion opportunities. It creates adaptive upper and lower reversion zones based on recent price action and volatility, while incorporating a momentum-biased equilibrium line that shifts based on volume-weighted price momentum. This creates a three-tier system where traders and investors can identify overbought and oversold conditions within established ranges, detect momentum exhaustion points, and anticipate channel breakouts or breakdowns. This indicator is particularly valuable for strategic dollar cost averaging (DCA) strategies, as it helps identify optimal accumulation zones during oversold conditions and provides tactical risk management levels for systematic investment approaches across different market conditions and asset classes.
🟢 How It Works
The indicator employs a four-stage calculation process that transforms raw price and volume data into actionable mean reversion signals. First, it establishes the base channel by calculating the highest high and lowest low over a user-defined lookback period, creating the foundational price range for mean reversion analysis. This channel adapts continuously as new price data becomes available, ensuring the system remains relevant to current market conditions.
In the second stage, the system calculates volume-weighted momentum by combining price momentum with volume activity. The momentum calculation takes the price change over a specified period and multiplies it by the volume ratio (current volume versus 20-period average volume, for instance) and a volume factor multiplier. This creates momentum readings that are more significant during high-volume periods and less influential during low-volume conditions.
The third stage creates the dynamic reversion zones using Average True Range (ATR) calculations. The upper reversion zone is positioned below the channel high by an ATR-based distance, while the lower reversion zone is positioned above the channel low. These zones contract when momentum is negative (upper zone) or positive (lower zone), creating asymmetric reversion bands that adapt to momentum conditions.
The final stage establishes the momentum-biased equilibrium line by calculating the midpoint between the reversion zones and adjusting it based on momentum bias. When momentum is positive, the equilibrium shifts upward; when negative, it shifts downward. This creates a dynamic reference level that helps identify when price action is moving against the prevailing momentum trend, signaling potential mean reversion opportunities.
🟢 How to Use
1. Mean Reversion Signal Identification
- Lower Reversion Zone Signals: When price reaches or falls below the lower reversion zone with bearish momentum, the system generates potential long/buy entry signals indicating oversold conditions within the established range.
- Upper Reversion Zone Signals: When price reaches or exceeds the upper reversion zone with bullish momentum, the system generates potential short/sell entry signals indicating overbought conditions.
2. Equilibrium Line Analysis and Momentum Exhaustion
- Equilibrium Breaks: The dynamic equilibrium line serves as a momentum bias indicator within the channel. Price crossing above equilibrium suggests shifting to bullish bias, while breaks below indicate bearish bias development within the mean reversion framework.
- Momentum Exhaustion Signals: The system identifies momentum exhaustion when price breaks through the equilibrium line opposite to the prevailing momentum direction. Bullish exhaustion occurs when price falls below equilibrium despite positive momentum, while bearish exhaustion happens when price rises above equilibrium during negative momentum periods.
3. Channel Expansion and Breakout Detection
- Channel Boundary Breaks: When price breaks above the upper reversion zone or below the lower reversion zone, it signals potential channel expansion or false breakout conditions. These events often precede significant trend changes or range expansion phases.
- Range Expansion Alerts: Breaks above the channel high or below the channel low indicate potential breakout from the mean reversion range, suggesting trend continuation or new directional movement beyond the established boundaries.
🟢 Pro Tips for Trading and Investing
→ Strategic DCA Optimization: Use the lower reversion zone as primary accumulation levels for dollar cost averaging strategies. When price reaches oversold conditions with bearish momentum exhaustion signals, it often represents optimal entry points for systematic investment programs, allowing investors to accumulate positions at statistically favorable price levels within the established range.
→ DCA Pause and Acceleration Signals: Monitor equilibrium line breaks to adjust DCA frequency and amounts. When price consistently trades below equilibrium with momentum exhaustion signals, consider accelerating DCA intervals or increasing investment amounts. Conversely, when price reaches upper reversion zones, consider pausing or reducing DCA activity until more favorable conditions return.
→ Momentum Divergence Detection: Watch for divergences between price action and momentum readings within the channel. When price makes new lows but momentum shows improvement, or price makes new highs with deteriorating momentum, these signal high-probability mean reversion setups ideal for contrarian investment approaches.
→ Alert-Based Systematic Investing/Trading: Utilize the comprehensive alert system for automated DCA triggers. Set up alerts for lower reversion zone touches combined with momentum exhaustion signals to create systematic entry points that remove emotional decision-making from long-term investment strategies, particularly effective for volatile assets where timing improvements can significantly impact overall returns.
僅限邀請腳本
僅作者批准的使用者才能訪問此腳本。您需要申請並獲得使用許可,通常需在付款後才能取得。更多詳情,請依照作者以下的指示操作,或直接聯絡QuantAlgo。
TradingView不建議在未完全信任作者並了解其運作方式的情況下購買或使用腳本。您也可以在我們的社群腳本中找到免費的開源替代方案。
作者的說明
🟢 Access HERE (use code PREMIUM50 for 50% OFF): https://whop.com/quantalgo/
👉 Access our best trading & investing tools here (3-day FREE trial): whop.com/quantalgo/
免責聲明
這些資訊和出版物並非旨在提供,也不構成TradingView提供或認可的任何形式的財務、投資、交易或其他類型的建議或推薦。請閱讀使用條款以了解更多資訊。