OPEN-SOURCE SCRIPT
Previous RTH Levels (RTH Only)
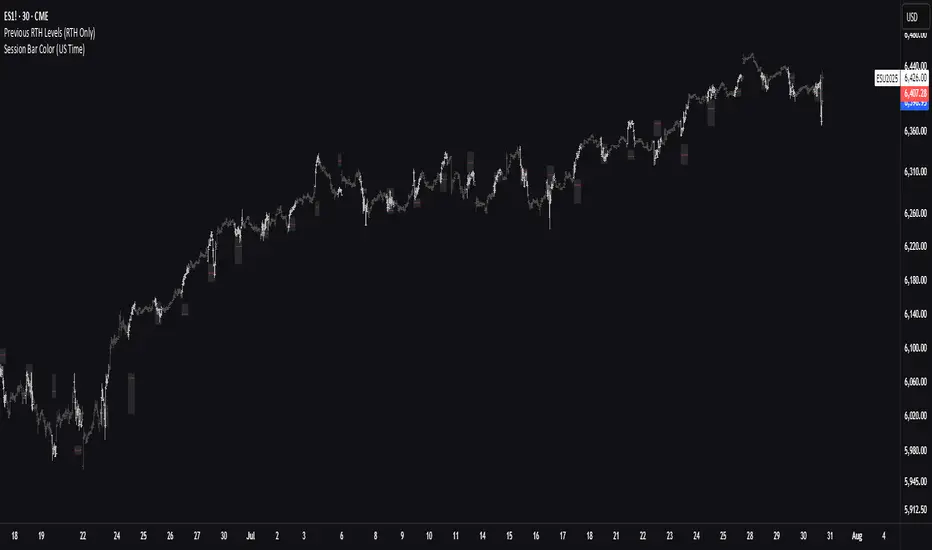
Previous RTH Levels on current session (RTH Only)
This indicator calculates key volume profile levels from the previous Regular Trading Hours (RTH) session and projects them onto the current RTH session. It is designed to provide traders with significant historical price levels—Point of Control (POC), Value Area High (VAH), and Value Area Low (VAL)—to use as potential support, resistance, and pivot points for intraday trading.
Instead of just plotting lines, this script highlights the entire Value Area (VA) between the VAH and VAL, offering a clear visual reference for the prior day's zone of price agreement.
開源腳本
秉持TradingView一貫精神,這個腳本的創作者將其設為開源,以便交易者檢視並驗證其功能。向作者致敬!您可以免費使用此腳本,但請注意,重新發佈代碼需遵守我們的社群規範。
免責聲明
這些資訊和出版物並非旨在提供,也不構成TradingView提供或認可的任何形式的財務、投資、交易或其他類型的建議或推薦。請閱讀使用條款以了解更多資訊。
免責聲明
這些資訊和出版物並非旨在提供,也不構成TradingView提供或認可的任何形式的財務、投資、交易或其他類型的建議或推薦。請閱讀使用條款以了解更多資訊。