OPEN-SOURCE SCRIPT
RESHA
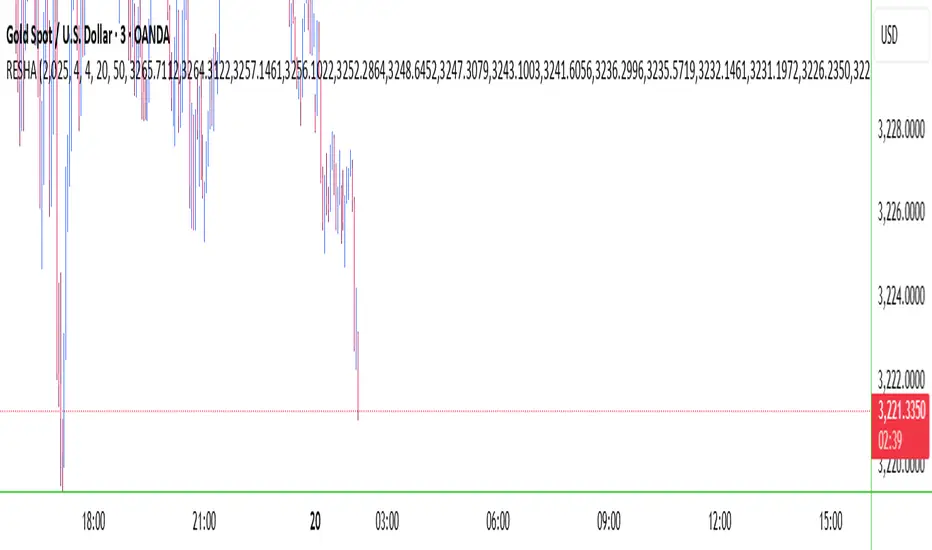
Indicator Name: RESHA – Static Price Levels
Description:
The RESHA indicator is a simple tool that allows traders to manually define multiple horizontal price levels on the chart. These levels are displayed as horizontal lines, each extending a customizable number of candles forward. Traders can input a comma-separated list of prices, which are then plotted automatically on the chart.
Features:
📍 Custom input box for price levels (comma-separated).
📏 Adjustable line length in bars.
Visual price labels at the end of each level.
Clean and minimalistic design, perfect for support/resistance zones or static analysis.
This tool is ideal for traders who want to keep key price zones visible at all times without relying on dynamic calculations or automated indicators.
開源腳本
秉持TradingView一貫精神,這個腳本的創作者將其設為開源,以便交易者檢視並驗證其功能。向作者致敬!您可以免費使用此腳本,但請注意,重新發佈代碼需遵守我們的社群規範。
免責聲明
這些資訊和出版物並非旨在提供,也不構成TradingView提供或認可的任何形式的財務、投資、交易或其他類型的建議或推薦。請閱讀使用條款以了解更多資訊。
免責聲明
這些資訊和出版物並非旨在提供,也不構成TradingView提供或認可的任何形式的財務、投資、交易或其他類型的建議或推薦。請閱讀使用條款以了解更多資訊。