OPEN-SOURCE SCRIPT
Sunset candles
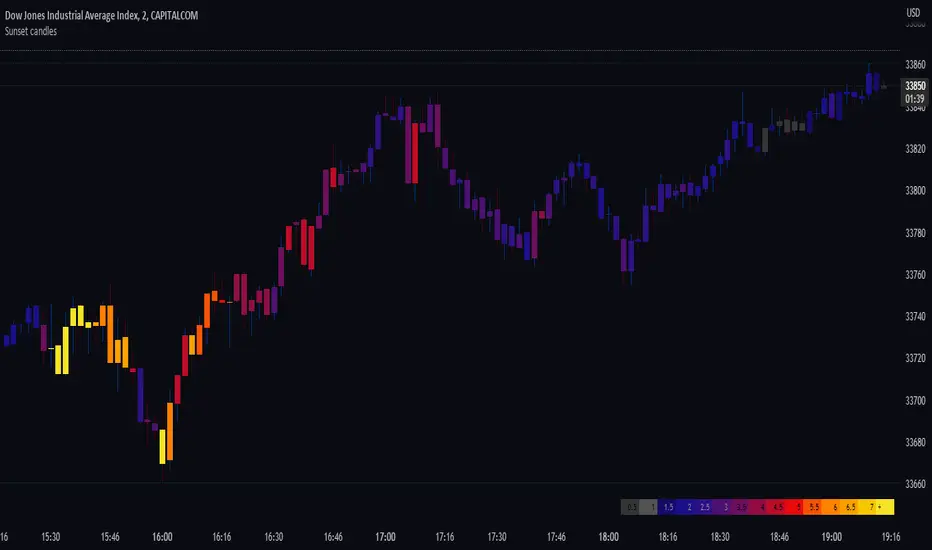
Displays the volume behind each candle with colors, to visualise their evolution over time, directly in the chart.
This indicator is best suited for dark mode (Suggested background color: #0a0c12).
The more intense is the color, the bigger is the volume.
The unit is a 400 periods moving average of the volume, considered as 1 volume.
Each color represents half of this volume. For ex: Grays indicate under (or equal) to the 400 MA (low volumes). Bright yellow represents above 7 times the 400 MA (very high volumes).
When there's no available volume datas, the candles turn bright green by default.
The wicks' colors stay the same, and can still indicate the direction of the candle.
In the settings, you can show/hide the gradient of the volume. By moving your chart over this gradient, it is possible to compare the candles to the colors, and read the corresponding volume number.
開源腳本
秉持TradingView一貫精神,這個腳本的創作者將其設為開源,以便交易者檢視並驗證其功能。向作者致敬!您可以免費使用此腳本,但請注意,重新發佈代碼需遵守我們的社群規範。
免責聲明
這些資訊和出版物並非旨在提供,也不構成TradingView提供或認可的任何形式的財務、投資、交易或其他類型的建議或推薦。請閱讀使用條款以了解更多資訊。
開源腳本
秉持TradingView一貫精神,這個腳本的創作者將其設為開源,以便交易者檢視並驗證其功能。向作者致敬!您可以免費使用此腳本,但請注意,重新發佈代碼需遵守我們的社群規範。
免責聲明
這些資訊和出版物並非旨在提供,也不構成TradingView提供或認可的任何形式的財務、投資、交易或其他類型的建議或推薦。請閱讀使用條款以了解更多資訊。