OPEN-SOURCE SCRIPT
Gann Support and Resistance Levels
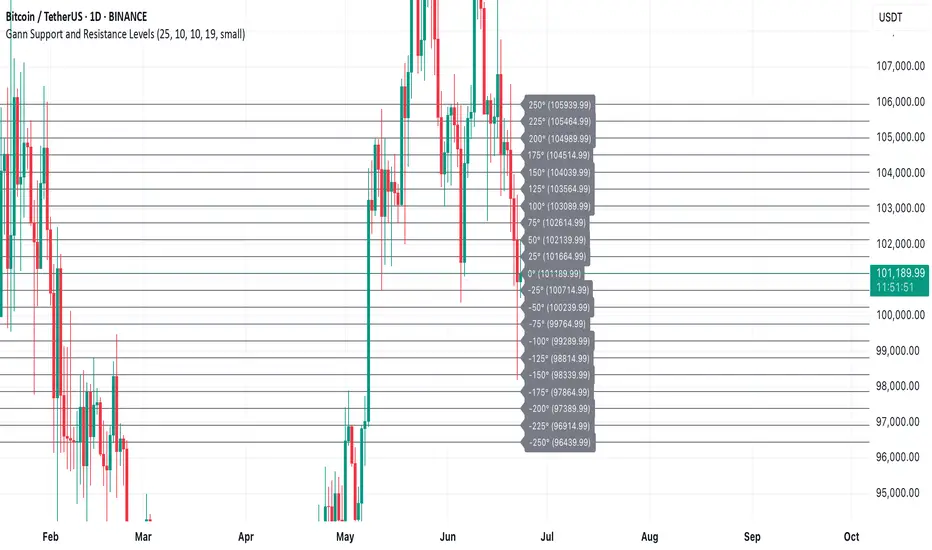
This indicator plots dynamic Gann Degree Levels as potential support and resistance zones around the current market price. You can fully customize the Gann degree step (e.g., 45°, 30°, 90°), the number of levels above and below the price, and the price movement per degree to fine-tune the levels to your strategy.
Key Features:
✅ Dynamic levels update automatically with the live price
✅ Adjustable degree intervals (Gann steps)
✅ User control over how many levels to display above and below
✅ Fully customizable label size, label color, and text color for mobile-friendly visibility
✅ Clean visual design for easy chart analysis
How to Use:
Gann levels can act as potential support and resistance zones.
Watch for price reactions at major degrees like 0°, 90°, 180°, and 270°.
Can be combined with other technical tools like price action, trendlines, or Gann fans for deeper analysis.
📌 This tool is perfect for traders using Gann theory, grid-based strategies, or those looking to enhance their visual trading setups with structured levels.
開源腳本
秉持TradingView一貫精神,這個腳本的創作者將其設為開源,以便交易者檢視並驗證其功能。向作者致敬!您可以免費使用此腳本,但請注意,重新發佈代碼需遵守我們的社群規範。
免責聲明
這些資訊和出版物並非旨在提供,也不構成TradingView提供或認可的任何形式的財務、投資、交易或其他類型的建議或推薦。請閱讀使用條款以了解更多資訊。
開源腳本
秉持TradingView一貫精神,這個腳本的創作者將其設為開源,以便交易者檢視並驗證其功能。向作者致敬!您可以免費使用此腳本,但請注意,重新發佈代碼需遵守我們的社群規範。
免責聲明
這些資訊和出版物並非旨在提供,也不構成TradingView提供或認可的任何形式的財務、投資、交易或其他類型的建議或推薦。請閱讀使用條款以了解更多資訊。