OPEN-SOURCE SCRIPT
Duong_Sideway Zone
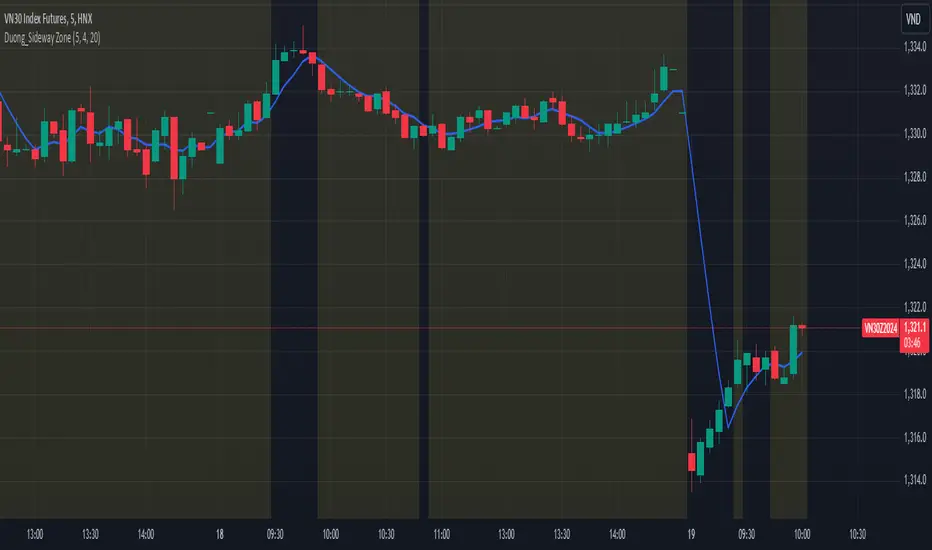
This indicator is designed to identify sideway (ranging) zones on the price chart. It uses a Moving Average (MA) and criteria such as the number of price crosses over the MA, as well as breakout checks, to determine whether the market is in a sideway state. When a sideway zone is detected, it is highlighted with a yellow background on the chart.
Key Features:
MA Line: Uses a Moving Average (MA) as the basis for trend identification.
Sideway Threshold: Based on the number of price crosses over the MA within a specific period.
Breakout Check: Excludes zones from being considered sideway if a breakout occurs beyond the ATR threshold.
Visual Highlighting: Highlights sideway zones with a yellow background for easy identification.
This indicator is ideal for traders looking to identify ranging market phases to adjust their trading strategies accordingly.
For example, if within the last 20 candles, the number of times the closing price crosses the MA5 is greater than 4, it is considered a sideway zone, except in cases where the closing price of a recent candle has broken out of the highest/ lowest price of the previous 20 candles.
開源腳本
秉持TradingView一貫精神,這個腳本的創作者將其設為開源,以便交易者檢視並驗證其功能。向作者致敬!您可以免費使用此腳本,但請注意,重新發佈代碼需遵守我們的社群規範。
免責聲明
這些資訊和出版物並非旨在提供,也不構成TradingView提供或認可的任何形式的財務、投資、交易或其他類型的建議或推薦。請閱讀使用條款以了解更多資訊。
開源腳本
秉持TradingView一貫精神,這個腳本的創作者將其設為開源,以便交易者檢視並驗證其功能。向作者致敬!您可以免費使用此腳本,但請注意,重新發佈代碼需遵守我們的社群規範。
免責聲明
這些資訊和出版物並非旨在提供,也不構成TradingView提供或認可的任何形式的財務、投資、交易或其他類型的建議或推薦。請閱讀使用條款以了解更多資訊。