OPEN-SOURCE SCRIPT
已更新 T.I.P. Hoffman's scalp indicator

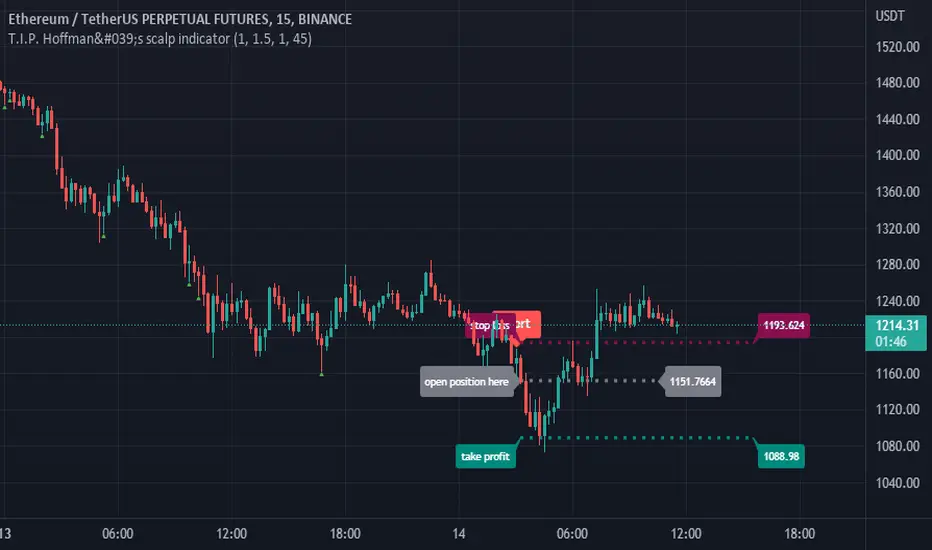
This script is based on Rob Hoffman's trading strategy. I do my best to implement and cover all necessary parts for the complete strategy, including multiple moving averages and Hoffman's retracement strategy according to bars (45%).
Difference that I do on my own is that my script follow the trend, based on SMA50, so script will not give you Long signals, including bar retracement signals, if price is not above the SMA50, while for Short signal is opposite rule. Long/Short signal will always show only in case if complete bar is away of SMA5, which means completely above for Long, or completely below SMA5 for Short. In that case SL will be on SMA5.
There is two ways to control take profit and stop loss lines, one with auto calculated - according to SMA5, and the other way is to put your desired % for SL and TP. First-Auto way is always calculate % differences between open position and SMA5, so in that case position of SMA5 will be SL while TP will be in size 1:1.5 .
I hope this script means something to someone. If there is some more tips-ways to improve it do not hesitate to contact me.
Best Regards to All of You!
發行說明
I add "Open position threshold %" option. It is %(high-low) of the signal bar, default value is 1, so this will gives option to set open position line away from exact point of wick of the respective bar, the same way that Hoffman's strategy suggest to open position - always slightly away from the wick of respective retracements bar.Enjoy!
發行說明
Added price as a labels for positions, so now there is exact price according to open/SL/TP lines.發行說明
In latest update I add alert option, from function, so now there is option to choose this as a alert, as Any alert() function call from alert settings.You will get alert in format:
SHORT alarm, Entry price: xxx.xxx, SL: xxx.xxx, TP: xxx.xxx
or
LONG alarm, Entry price: xxx.xxx, SL: xxx.xxx, TP: xxx.xxx
發行說明
*Clean some minor things in code and fix problem with signals label (above/below candles) for those assets with small price*Added Volume Oscillator as optional parameter to use for signals, gives less but more accurate signals
*Added ATR for stop loss as optional parameter to use with all the settings for ATR, including showing it on chart if needed
*Added risk reward ration, so now there is option to change it.
*Added circles (red/green) as plot on chart so now you have history for signals, this will help to see it on chart and determine changes if you are using volume oscillator for signals or not, to see the differences in signals.
If for stop loss is used ATR or MA, then take profit will change according to risk reward ratio you set (default is 1.5 : 1).
If non of this two is used there is still manual % for stop loss and take profit.
Enjoy!
開源腳本
秉持TradingView一貫精神,這個腳本的創作者將其設為開源,以便交易者檢視並驗證其功能。向作者致敬!您可以免費使用此腳本,但請注意,重新發佈代碼需遵守我們的社群規範。
免責聲明
這些資訊和出版物並非旨在提供,也不構成TradingView提供或認可的任何形式的財務、投資、交易或其他類型的建議或推薦。請閱讀使用條款以了解更多資訊。
開源腳本
秉持TradingView一貫精神,這個腳本的創作者將其設為開源,以便交易者檢視並驗證其功能。向作者致敬!您可以免費使用此腳本,但請注意,重新發佈代碼需遵守我們的社群規範。
免責聲明
這些資訊和出版物並非旨在提供,也不構成TradingView提供或認可的任何形式的財務、投資、交易或其他類型的建議或推薦。請閱讀使用條款以了解更多資訊。