PROTECTED SOURCE SCRIPT
已更新 Monthly, Daily, 4H High Low (v2 Corrected)
Multi-Timeframe Highs & Lows (M, D, 4H) with Alerts
Script Description:
Summary
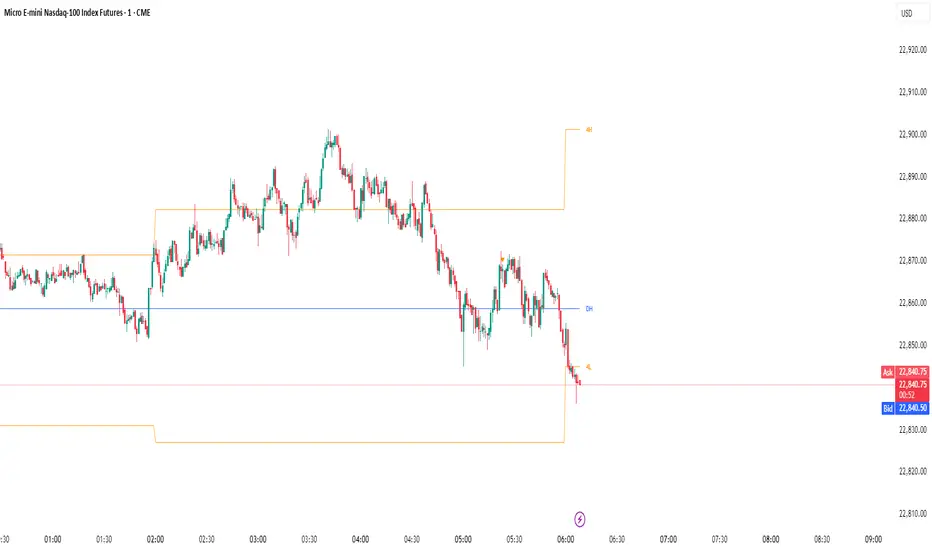
This indicator is a powerful tool designed to streamline your technical analysis by plotting the most significant price levels from higher timeframes directly onto your chart. It automatically draws the previous Monthly, Daily, and 4-Hour High and Low levels, allowing you to identify key support and resistance zones without constantly switching between timeframes.
The clean, minimalist design ensures your chart remains uncluttered, while the built-in, customizable alert system notifies you instantly when the price interacts with these critical levels.
Key Features
Automatic High & Low Plotting: Visualizes the previous high and low for three key timeframes:
Monthly High & Low (Red lines)
Daily High & Low (Blue lines)
4-Hour High & Low (Orange lines)
Clear On-Chart Labels: Each line is accompanied by a small, non-intrusive label (e.g., "Monthly High") on the right side of the chart for easy identification.
Powerful Alert System: Never miss a key price reaction. The script includes a fully configurable alert system that triggers when the price crosses any of the plotted high or low levels.
Customizable Alerts: In the indicator settings, you can individually enable or disable alerts for each timeframe (Monthly, Daily, 4H), giving you full control over your notifications.
How to Use
The lines plotted by this indicator serve as powerful, objective levels of support and resistance.
Resistance: The high of a previous period (e.g., Daily High) often acts as a ceiling where price may struggle to break through.
Support: The low of a previous period (e.g., Daily Low) often acts as a floor where price may find buying interest.
Breakout/Breakdown Confirmation: A decisive close above a previous high or below a previous low can signal a potential continuation of the trend. Use the alerts to be notified of these events in real-time.
Liquidity Sweeps: Traders often watch for price to briefly "sweep" or "hunt" these levels before reversing. The alert system is perfect for catching these movements.
Setting Up Alerts
Add the indicator to your chart.
Click the Alert icon (clock symbol) in the TradingView toolbar.
In the "Condition" dropdown, select the indicator: "Multi-Timeframe Highs & Lows (v2 Corrected)".
A second dropdown will appear. Select the specific event you want to be notified about (e.g., "Cross Daily High" or "Cross 4H Low").
Choose your preferred alert settings (e.g., "Once Per Bar Close") and notification method.
Click "Create".
You can create multiple alerts for different levels as needed.
This tool was designed to be both simple and effective, helping traders make more informed decisions by keeping an eye on the bigger picture. Happy trading!
Script Description:
Summary
This indicator is a powerful tool designed to streamline your technical analysis by plotting the most significant price levels from higher timeframes directly onto your chart. It automatically draws the previous Monthly, Daily, and 4-Hour High and Low levels, allowing you to identify key support and resistance zones without constantly switching between timeframes.
The clean, minimalist design ensures your chart remains uncluttered, while the built-in, customizable alert system notifies you instantly when the price interacts with these critical levels.
Key Features
Automatic High & Low Plotting: Visualizes the previous high and low for three key timeframes:
Monthly High & Low (Red lines)
Daily High & Low (Blue lines)
4-Hour High & Low (Orange lines)
Clear On-Chart Labels: Each line is accompanied by a small, non-intrusive label (e.g., "Monthly High") on the right side of the chart for easy identification.
Powerful Alert System: Never miss a key price reaction. The script includes a fully configurable alert system that triggers when the price crosses any of the plotted high or low levels.
Customizable Alerts: In the indicator settings, you can individually enable or disable alerts for each timeframe (Monthly, Daily, 4H), giving you full control over your notifications.
How to Use
The lines plotted by this indicator serve as powerful, objective levels of support and resistance.
Resistance: The high of a previous period (e.g., Daily High) often acts as a ceiling where price may struggle to break through.
Support: The low of a previous period (e.g., Daily Low) often acts as a floor where price may find buying interest.
Breakout/Breakdown Confirmation: A decisive close above a previous high or below a previous low can signal a potential continuation of the trend. Use the alerts to be notified of these events in real-time.
Liquidity Sweeps: Traders often watch for price to briefly "sweep" or "hunt" these levels before reversing. The alert system is perfect for catching these movements.
Setting Up Alerts
Add the indicator to your chart.
Click the Alert icon (clock symbol) in the TradingView toolbar.
In the "Condition" dropdown, select the indicator: "Multi-Timeframe Highs & Lows (v2 Corrected)".
A second dropdown will appear. Select the specific event you want to be notified about (e.g., "Cross Daily High" or "Cross 4H Low").
Choose your preferred alert settings (e.g., "Once Per Bar Close") and notification method.
Click "Create".
You can create multiple alerts for different levels as needed.
This tool was designed to be both simple and effective, helping traders make more informed decisions by keeping an eye on the bigger picture. Happy trading!
發行說明
Multi-Timeframe High/Low Levels with Realtime AlertsDescription:
This indicator streamlines your technical analysis by plotting the previous Monthly, Daily, and 4-Hour high and low levels directly onto your chart. These levels often act as critical support and resistance zones, providing you with an instant map of the market's most significant price points without needing to switch timeframes.
The script is designed to be clean and efficient, featuring minimalist, real-time labels that move along the right edge of your chart for easy identification (e.g., "MH" for Monthly High).
Key Features:
Automatically plots the previous Monthly, Daily, and 4H high/low lines.
Clean, moving labels (MH, ML, DH, DL, 4H, 4L) on the right axis for a clear view.
A fully customizable alert system to notify you instantly when the price crosses any of these key levels.
How to Set Up Alerts:
Open the "Alerts" panel in TradingView.
Select this indicator as the condition.
You only need to create one alert. The notification message will automatically tell you exactly which level was hit (e.g., "Daily Low Swept at 25100.5").
In the indicator settings, you can toggle which timeframes (Monthly, Daily, 4H) you want to receive alerts for.
受保護腳本
此腳本以閉源形式發佈。 不過,您可以自由使用,沒有任何限制 — 點擊此處了解更多。
免責聲明
這些資訊和出版物並非旨在提供,也不構成TradingView提供或認可的任何形式的財務、投資、交易或其他類型的建議或推薦。請閱讀使用條款以了解更多資訊。
免責聲明
這些資訊和出版物並非旨在提供,也不構成TradingView提供或認可的任何形式的財務、投資、交易或其他類型的建議或推薦。請閱讀使用條款以了解更多資訊。