PROTECTED SOURCE SCRIPT
已更新 TrendLine + Alerts
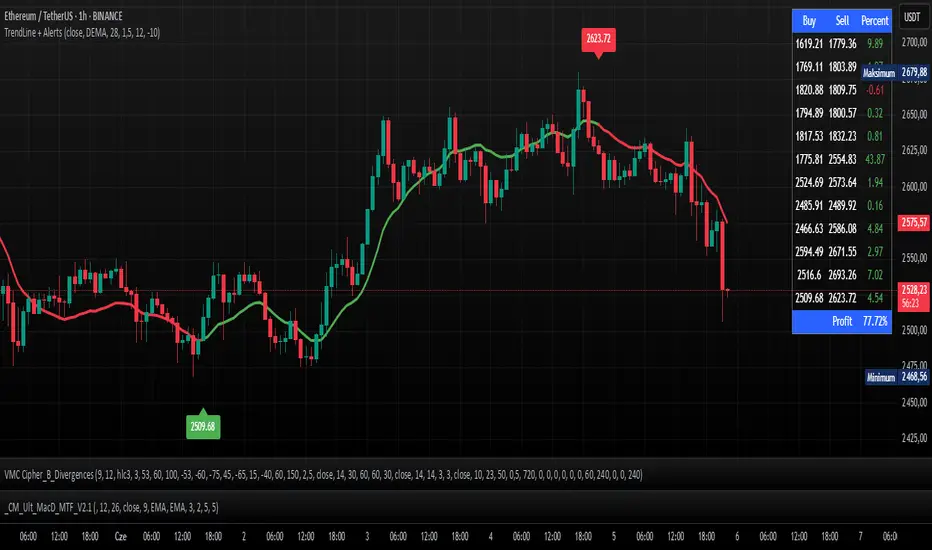
The TrendLine + Alerts indicator is an advanced technical analysis tool designed to quickly identify trend direction using various moving averages and RMSD deviation. It dynamically generates buy and sell signals and visually marks entry points with price labels on the chart. Additionally, an optional transaction table can be toggled on or off, displaying buy and sell prices along with the percentage returns of individual trades and an aggregated summary row, facilitating the evaluation of trading strategy performance.
🔧 Key Features:
- Supports multiple moving average types: SMA, EMA, HMA, DEMA, TEMA, RMA, FRAMA
- Dynamic trend analysis based on RMSD deviation, adaptable to current market conditions
- Color-coded trend indication: green for uptrends, red for downtrends
- Alert generation: real-time buy and sell signals (TrendLine BUY / SELL)
- Price labels on the chart for better visualization of entry/exit points
- Interactive settings panel allowing selection of data source (open, close, high, low etc.), adjustable moving average length, and RMSD deviation multiplier
- Optionally displays a dynamic transaction table (toggleable via chart settings) that shows:
- Buy: entry prices
- Sell: exit prices
- Percent: percentage return of each trade, displayed as a number
- A summary row that aggregates the percentage returns, offering a quick evaluation of trading performance
⚙️ Settings:
- Ability to select the data source: open, close, high, low, oc2, hl2, occ3, hlc3, ohlc4, hlcc4
- Adjustable moving average length
- Customizable RMSD deviation multiplier
- Toggle switch to enable or disable the transaction table
🚀 Application:
Ideal for traders seeking an effective method to identify trends and turning points in the market. It is suitable for both short-term day trading and long-term trend analysis, with adjustable settings to suit individual trading strategies.
發行說明
Add StopLoss受保護腳本
此腳本以閉源形式發佈。 不過,您可以自由使用,沒有任何限制 — 點擊此處了解更多。
免責聲明
這些資訊和出版物並非旨在提供,也不構成TradingView提供或認可的任何形式的財務、投資、交易或其他類型的建議或推薦。請閱讀使用條款以了解更多資訊。
免責聲明
這些資訊和出版物並非旨在提供,也不構成TradingView提供或認可的任何形式的財務、投資、交易或其他類型的建議或推薦。請閱讀使用條款以了解更多資訊。