OPEN-SOURCE SCRIPT
Moving Average Channel
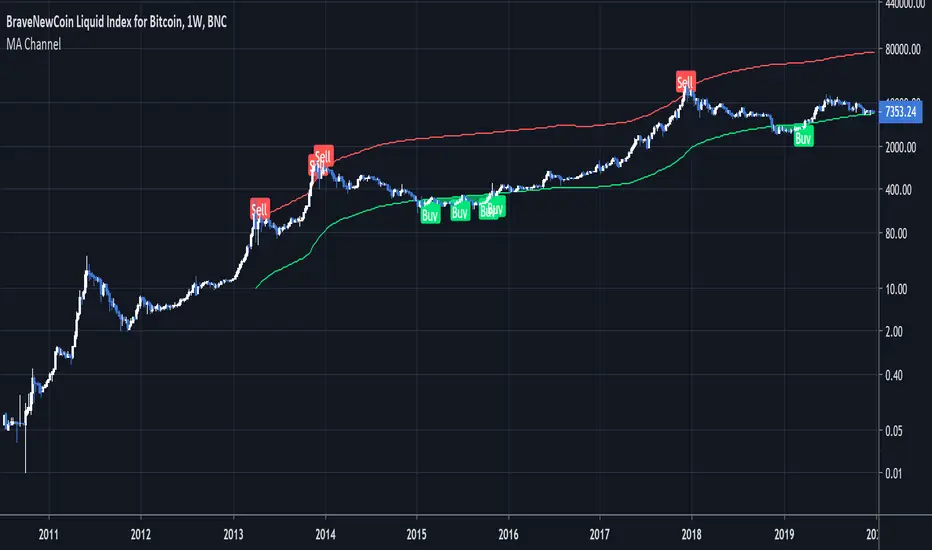
Intended for use on BTC long term (BNC:BLX Weekly) with Logarithmic charts only
As Bitcoin is adopted, it moves through market cycles. These are created by periods where market participants are over-excited causing the price to over-extend, and periods where they are overly pessimistic where the price over-contracts. Identifying and understanding these periods can be beneficial to the long term investor. This long term investment tool is a simple and effective way to highlight those periods.
Buying Bitcoin when the price drops below the green line has historically generated outsized returns. Selling Bitcoin when price goes above the red line has been historically effective for taking profits.
NOTE: 144 Week = 2¾ Years. 104 Weeks = 2 Years. Originally created by Philip Swift
開源腳本
秉持TradingView一貫精神,這個腳本的創作者將其設為開源,以便交易者檢視並驗證其功能。向作者致敬!您可以免費使用此腳本,但請注意,重新發佈代碼需遵守我們的社群規範。
免責聲明
這些資訊和出版物並非旨在提供,也不構成TradingView提供或認可的任何形式的財務、投資、交易或其他類型的建議或推薦。請閱讀使用條款以了解更多資訊。
開源腳本
秉持TradingView一貫精神,這個腳本的創作者將其設為開源,以便交易者檢視並驗證其功能。向作者致敬!您可以免費使用此腳本,但請注意,重新發佈代碼需遵守我們的社群規範。
免責聲明
這些資訊和出版物並非旨在提供,也不構成TradingView提供或認可的任何形式的財務、投資、交易或其他類型的建議或推薦。請閱讀使用條款以了解更多資訊。