OPEN-SOURCE SCRIPT
已更新 True ATH/ATL w/ labels
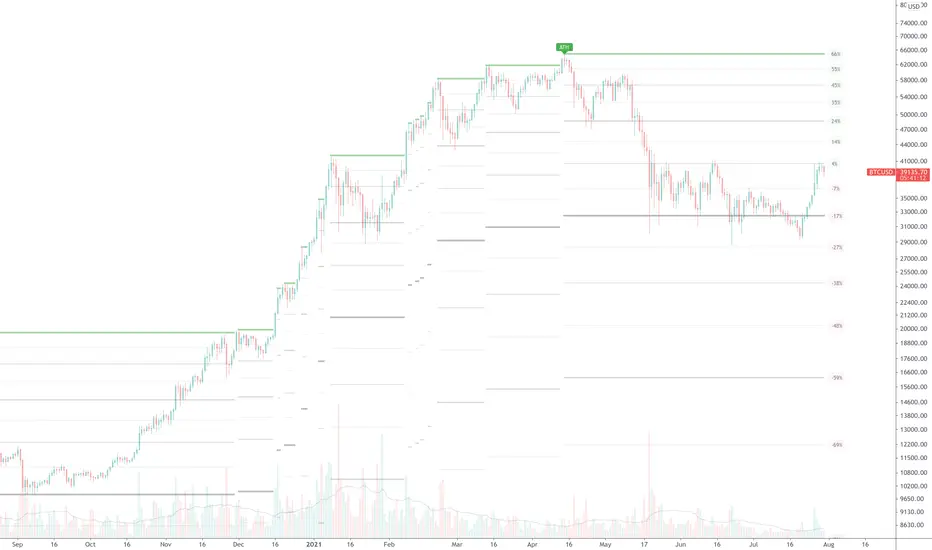
Plots the All Time High and All Time Low, with optional labels when a new ATH/ATL is created. Reaches all the way back in history for the true high/low, not limited to the most recent 5000 candles like most scripts. Works on all time frames.
發行說明
- Show distance in percent from current price.
- Draw dividing lines between ATH and ATL.
The optional dividing lines provide good support and resistance targets. Works on all time frames and instruments, but particularly rangy stocks.
發行說明
(Update example chart to remove stray drawings)開源腳本
本著TradingView的真正精神,此腳本的創建者將其開源,以便交易者可以查看和驗證其功能。向作者致敬!雖然您可以免費使用它,但請記住,重新發佈程式碼必須遵守我們的網站規則。
免責聲明
這些資訊和出版物並不意味著也不構成TradingView提供或認可的金融、投資、交易或其他類型的意見或建議。請在使用條款閱讀更多資訊。
免責聲明
這些資訊和出版物並不意味著也不構成TradingView提供或認可的金融、投資、交易或其他類型的意見或建議。請在使用條款閱讀更多資訊。