OPEN-SOURCE SCRIPT
Search for consolidations - AstroHub
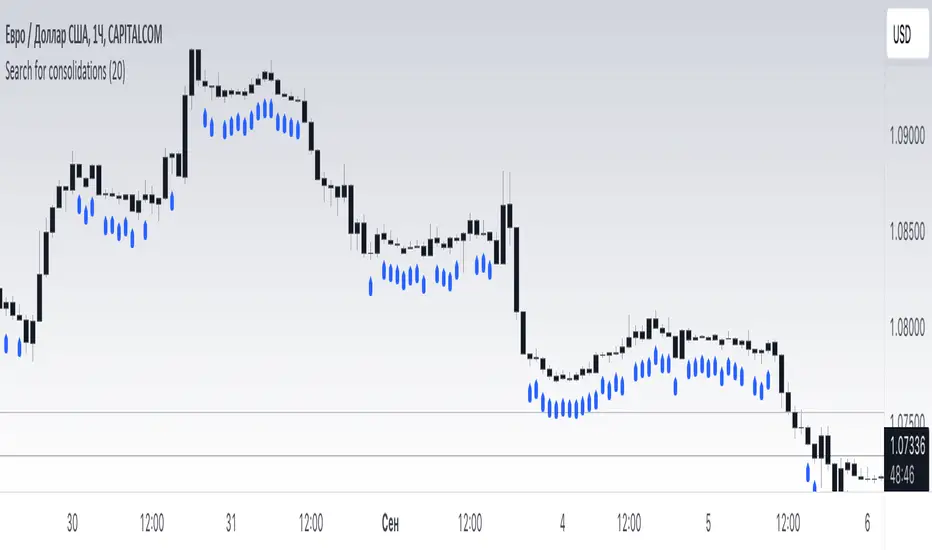
The indicator is designed to identify consolidation periods on the chart of a trading instrument.
Key factors and parameters to consider when using this indicator:
How to use the indicator:
Important points to consider when using this indicator:
I hope this description helps you better understand and assess the functionality and application of this indicator. Good luck with your usage!
Key factors and parameters to consider when using this indicator:
- 1. Consolidation length (consol_length): This parameter allows you to set the length of the period in which consolidation will be sought. The higher the value, the longer consolidation periods will be taken into account. The recommended value is 20.
- 2. Calculation of the mathematical model: The indicator is based on a mathematical model that calculates the average price range (avg_range) within the specified consolidation period. Then, the exponential moving average of the obtained values is averaged (ta.rma) to obtain consolidation. If the price range is smaller than the consolidation value, the current period is considered consolidation.
- 3. Chart display: The program allows you to display consolidation on the chart as a label (plotshape) beneath the candlesticks. Consolidation will be shown in blue with the label "Consolidation". The indicator is placed below the current candlesticks.
How to use the indicator:
- 1. Load the script into your market analysis platform (e.g. TradingView).
- 2. Set the desired consolidation length (consol_length).
- 3. The indicator will automatically calculate consolidation based on the specified length.
- 4. Blue labels with the text "Consolidation" will be displayed on the chart for each consolidation period.
Important points to consider when using this indicator:
- 1. The indicator does not predict the direction of price movement after consolidation. It only shows consolidation periods on the chart.
- 2. The results of the indicator may vary depending on the chosen consolidation length. It is recommended to conduct several experiments with different values to find the optimal period for the instrument and timeframe.
I hope this description helps you better understand and assess the functionality and application of this indicator. Good luck with your usage!
開源腳本
秉持TradingView一貫精神,這個腳本的創作者將其設為開源,以便交易者檢視並驗證其功能。向作者致敬!您可以免費使用此腳本,但請注意,重新發佈代碼需遵守我們的社群規範。
免責聲明
這些資訊和出版物並非旨在提供,也不構成TradingView提供或認可的任何形式的財務、投資、交易或其他類型的建議或推薦。請閱讀使用條款以了解更多資訊。
免責聲明
這些資訊和出版物並非旨在提供,也不構成TradingView提供或認可的任何形式的財務、投資、交易或其他類型的建議或推薦。請閱讀使用條款以了解更多資訊。