OPEN-SOURCE SCRIPT
Donchian and Keltner Channels Trend Following with Trailing Stop
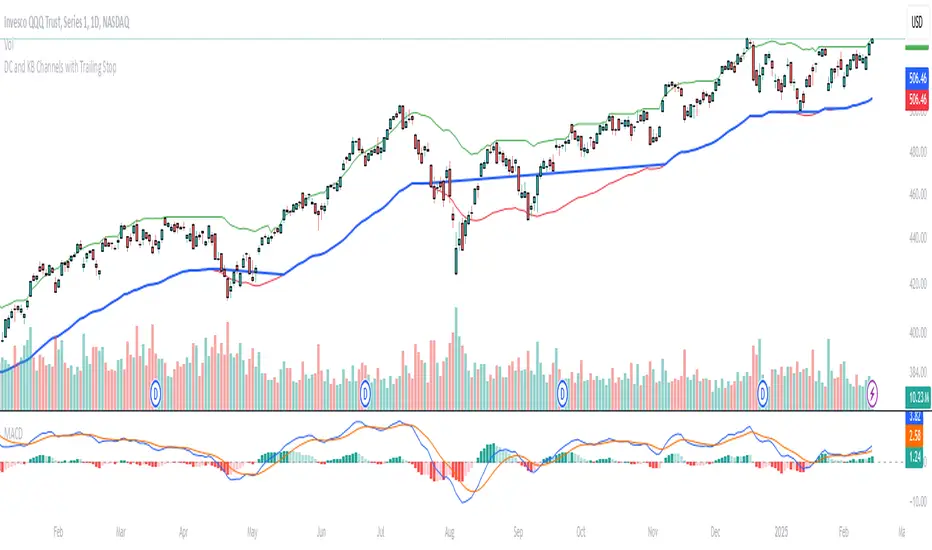
Long Only Trend-following model based on Keltner Channels and Donchian Channels.
These indicators include a noise region, which allows prices to oscillate without requiring position adjustments.
When price trades above the upper band, it signals strength; when it trades below the lower band, it signals weakness.
Keltner Channels
Keltner Channels are volatility-based envelopes set above and below an exponential moving average. Keltner Channels use the Average True Range (ATR), which measures daily volatility, to set channel distance.
Donchian Channel
Donchian Channels are are used to identify market trends and volatility. The upper and lower bands are based on the highest high and lowest low of a specified period. When the price moves above the upper band, it indicates a bullish breakout, while a
move below the lower band indicates a bearish breakout. The distance between the upper and lower channel of the Donchian Channel indicates the asset’s volatility.
Trend Following Model
The default settings are:
Upper Keltner and Upper Donchian Channel Length : 20
Lower Keltner and Lower Donchian Channel Length : 40
Keltner ATR Multiplier: 2
Entries, Exits and Trailing Stop
Trailing Stop
This is a stop-loss order that moves with the price of the underlying. It is designed to “trail” the price up (in the case of a long position) or down (for a short position), locking in profits as the price moves in a favorable direction.
At the end of day t, there was a Trailing Stop level in place. For the next day (day t + 1), the Trailing Stop will be adjusted. The new Trailing Stop will be the higher of two values:
These indicators include a noise region, which allows prices to oscillate without requiring position adjustments.
When price trades above the upper band, it signals strength; when it trades below the lower band, it signals weakness.
Keltner Channels
Keltner Channels are volatility-based envelopes set above and below an exponential moving average. Keltner Channels use the Average True Range (ATR), which measures daily volatility, to set channel distance.
Donchian Channel
Donchian Channels are are used to identify market trends and volatility. The upper and lower bands are based on the highest high and lowest low of a specified period. When the price moves above the upper band, it indicates a bullish breakout, while a
move below the lower band indicates a bearish breakout. The distance between the upper and lower channel of the Donchian Channel indicates the asset’s volatility.
Trend Following Model
The default settings are:
Upper Keltner and Upper Donchian Channel Length : 20
Lower Keltner and Lower Donchian Channel Length : 40
Keltner ATR Multiplier: 2
Entries, Exits and Trailing Stop
- Entry: When price exceeds the upper band of at least one of these indicators.
- Exit: When price undercuts the lower band of at least one of these indicators.
- Trailing Stop: See below.
Trailing Stop
This is a stop-loss order that moves with the price of the underlying. It is designed to “trail” the price up (in the case of a long position) or down (for a short position), locking in profits as the price moves in a favorable direction.
At the end of day t, there was a Trailing Stop level in place. For the next day (day t + 1), the Trailing Stop will be adjusted. The new Trailing Stop will be the higher of two values:
- The Trailing Stop from the previous day (day t).
- The Lower Band computed at the end of day t + 1.
開源腳本
秉持TradingView一貫精神,這個腳本的創作者將其設為開源,以便交易者檢視並驗證其功能。向作者致敬!您可以免費使用此腳本,但請注意,重新發佈代碼需遵守我們的社群規範。
免責聲明
這些資訊和出版物並非旨在提供,也不構成TradingView提供或認可的任何形式的財務、投資、交易或其他類型的建議或推薦。請閱讀使用條款以了解更多資訊。
免責聲明
這些資訊和出版物並非旨在提供,也不構成TradingView提供或認可的任何形式的財務、投資、交易或其他類型的建議或推薦。請閱讀使用條款以了解更多資訊。