OPEN-SOURCE SCRIPT
Seasonality Charts
How to use: open monthly chart
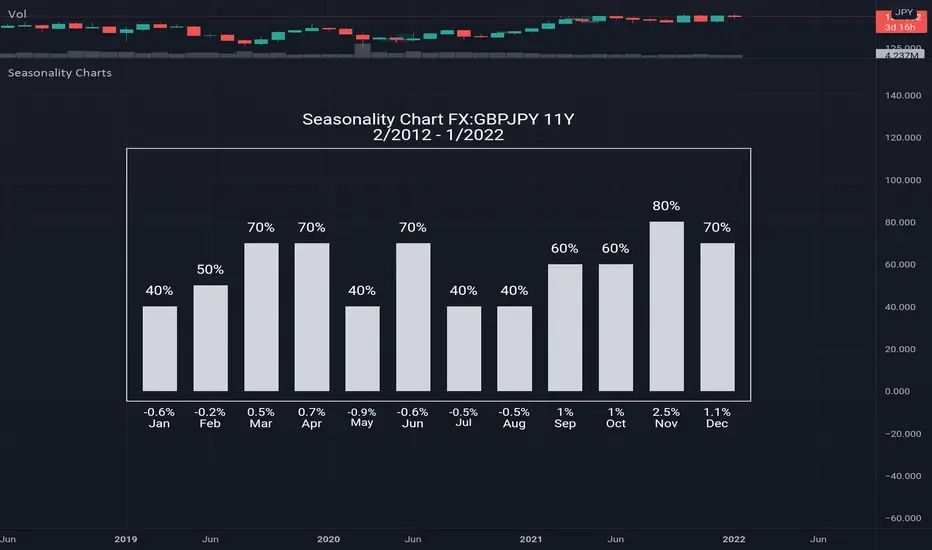
What this chart show: The seasonality tool calculates two numbers: the percentage of time that the month is positive above histogram and the average gain/loss for the month below histogram
Seasonality tells us what has happened in the past, which is the historical tendency. There is certainly no guarantee that past performance will equal future performance, but traders can look for above average tendencies to complement other signals. On the face of it, a bullish bias is present when a security shows gains more than 50% of the time for a particular month. Conversely, a bearish bias is present when a security rises less than 50% of the time. While 50% represents the exact middle, chartists should look for more extreme readings that suggest a relatively strong tendency.
開源腳本
秉持TradingView一貫精神,這個腳本的創作者將其設為開源,以便交易者檢視並驗證其功能。向作者致敬!您可以免費使用此腳本,但請注意,重新發佈代碼需遵守我們的社群規範。
免責聲明
這些資訊和出版物並非旨在提供,也不構成TradingView提供或認可的任何形式的財務、投資、交易或其他類型的建議或推薦。請閱讀使用條款以了解更多資訊。
免責聲明
這些資訊和出版物並非旨在提供,也不構成TradingView提供或認可的任何形式的財務、投資、交易或其他類型的建議或推薦。請閱讀使用條款以了解更多資訊。